User Behavior Analysis with Window Join on Clickstream Data
Welcome to this detailed tutorial on how to analyze user behavior by correlating clickstream data with purchase data using Pathway Live Data Framework's window join functionality. Joining clickstream data with purchase data can be particularly useful for businesses in analyzing the success of product page visits converting into purchases, improving their marketing strategies and product offerings.
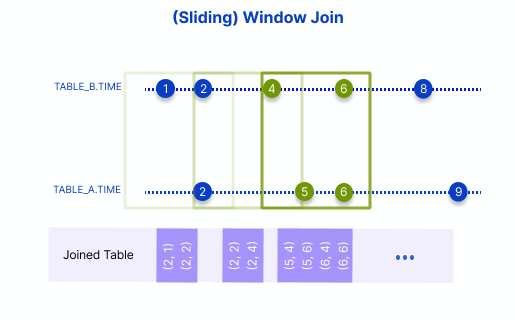
The window_join function from Pathway Live Data Framework associates records from two different tables that occur within the same time frame, specified by a window of time, creating sets of temporally correlated records.
In a window_join, all pairs of records that fall within the same window and satisfy the specified conditions are joined together. This operation is performed for each window whether it is a sliding window, a session window or a tumbling window. In the case of a sliding window, this means the window slides across the time axis, capturing different subsets of records at each step.
Consider an e-commerce example: the window join can be used to identify instances where product page visits and purchases occurred within the same hour. The time window and conditions could be adjusted to cater to different business questions and analysis requirements. This makes the window join an incredibly powerful tool for temporal data analysis, allowing us to track and analyze patterns over time and within specific timeframes.
In our hypothetical e-commerce example, there are two datasets:
- Clickstream data: It captures the user's interaction with the website. Each row records a user visit to a specific product page.
- Purchase data: It records all successful purchases made by the users.
The goal here is to monitor the evolution of conversion rates for each product page. In this context, a conversion refers to a scenario where a page visit and a purchase occur within a defined time window. You will be using the window_join functionality provided by Pathway for this purpose.
Let's break down the process into step-by-step instructions.
Setting Up the Data
First, import the necessary Pathway Live Data Framework library and load the clickstream and purchase data.
import pathway as pw
clickstream_data = pw.debug.table_from_markdown(
    """
    |   user_id |   session_id  |   datetime            |   page_url
1   |  0x1f8b4c |   0x64a0c7    |   2023-06-06T14:00:12 |   /home
2   |  0x1f8b4c |   0x64a0c7    |   2023-06-06T14:01:38 |   /products/0x11b87b
3   |  0x2eaf7f |   0x22e5b3    |   2023-06-06T14:18:32 |   /products/0x04g7d5
4   |  0x2eaf7f |   0xf508e6    |   2023-06-06T14:19:17 |   /products/0x04g7d5
5   |  0x31a32e |   0x13f6c4    |   2023-06-06T14:21:55 |   /products/0x11b87b
6   |  0x442d6e |   0x31d4a2    |   2023-06-06T14:23:51 |   /products/0x11b87b
7   |  0x5c2d6e |   0x13f6c4    |   2023-06-06T14:29:59 |   /products/0x04g7d5
"""
)
purchase_data = pw.debug.table_from_markdown(
    """
    | purchase_id | user_id | datetime              | product_url
 1  | 0x0a1b2c    | 0x1f8b4c| 2023-06-06T14:02:15   | /products/0x11b87b
 2  | 0x0b1a2d    | 0x32ad44| 2023-06-06T14:03:25   | /products/0x04g7d5
 3  | 0x0c1b3d    | 0x11da93| 2023-06-06T14:23:11   | /products/0x11b87b
 4  | 0x0d1e3f    | 0x2eaf7f| 2023-06-06T14:27:32   | /products/0x04g7d5
 5  | 0x023cc3    | 0x5c2d6e| 2023-06-06T14:45:56   | /products/0x04g7d5
 6  | 0x0e1f4g    | 0x442d6e| 2023-06-06T14:55:22   | /products/0x11b87b
"""
)
Preprocessing the Data
Records that do not pertain to product page visits are filtered out, and the datetime string column is converted to a datetime object. This process ensures that the datasets involved are not only relevant to the analysis but also formatted appropriately for the window_join function.
fmt = "%Y-%m-%dT%H:%M:%S"

clickstream_data = clickstream_data.with_columns(
    datetime=pw.this.datetime.dt.strptime(fmt)
).filter(pw.this.page_url.str.startswith("/products/"))


purchase_data = purchase_data.with_columns(datetime=pw.this.datetime.dt.strptime(fmt))
Perform the Window Join
The critical step in this process is performing a window join on the prepared data. The idea is to monitor the fluctuations of the hourly conversion rates. To achieve this, a sliding window is an appropriate tool. The frequency at which new values are produced can be parameterized by the choice of the hop. By opting for a left join, purchases without any corresponding clickstream data are omitted, effectively disregarding purchases made through other channels.
matched_data = clickstream_data.window_join_left(
    purchase_data,
    clickstream_data.datetime,
    purchase_data.datetime,
    pw.temporal.sliding(hop=pw.Duration("10m"), duration=pw.Duration("1h")),
    pw.left.user_id == pw.right.user_id,
    pw.left.page_url == pw.right.product_url,
).select(
    window_start=pw.left._pw_window_start,
    user_id=pw.left.user_id,
    page_url=pw.left.page_url,
    product_url=pw.right.product_url,
    purchase_id=pw.right.purchase_id,
)
Let's dissect the window_join_left function and its arguments:
This function joins the clickstream data (left) with the purchase data (right) in each window. The arguments of this function are:
purchase_data: The right side of the join.clickstream_data.datetimeandpurchase_data.datetime: These are the time expressions that will be used for joining the datasets.pw.temporal.sliding(hop=Duration('10m'), duration=Duration('1h')): This creates a sliding window of 1 hour with a hop duration of 10 minutes. It means that a new window is created every 10 minutes, and each window spans 1 hour.pw.left.user_id == pw.right.user_idandpw.left.page_url == pw.right.product_url: These conditions are used to join the datasets. Only those records that meet these conditions will be joined together.
This approach helps in identifying instances where a user visited a product page and made a purchase of the same product within that hour. For more accuracy, it is logical to expect purchases to occur after the page visits. To ensure this, you can filter out the records where the purchase datetime is earlier than the clickstream datetime or use another type of temporal join known as an interval_join.
from datetime import datetime
view_window_start = datetime(2023, 6, 6, 13, 30, 0)
pw.debug.compute_and_print(
    matched_data.filter(pw.this.window_start == view_window_start)
)
            | window_start        | user_id  | page_url           | product_url        | purchase_id
^V8GN5P1... | 2023-06-06 13:30:00 | 0x1f8b4c | /products/0x11b87b | /products/0x11b87b | 0x0a1b2c
^ZPQNJ85... | 2023-06-06 13:30:00 | 0x2eaf7f | /products/0x04g7d5 | /products/0x04g7d5 | 0x0d1e3f
^ZPQZ91H... | 2023-06-06 13:30:00 | 0x2eaf7f | /products/0x04g7d5 | /products/0x04g7d5 | 0x0d1e3f
^W5FVZM4... | 2023-06-06 13:30:00 | 0x31a32e | /products/0x11b87b |                    |
^D0JDF6E... | 2023-06-06 13:30:00 | 0x442d6e | /products/0x11b87b |                    |
^PF6P4EW... | 2023-06-06 13:30:00 | 0x5c2d6e | /products/0x04g7d5 |                    |
Calculating Conversion Rates
The next step is to calculate the conversion rate, i.e., the proportion of product page visits that resulted in a purchase. Prior to that, it's crucial to first address a potential data discrepancy that could skew our analysis - the presence of duplicate matches within each window. Let's consider a situation where a user visits a product page twice and makes a purchase within the same time window. This would lead to the generation of two matches - a redundancy you'd want to avoid. To ensure the robustness of the data, you could employ a comprehensive groupby operation across all columns, effectively eliminating these duplicate entries. By retaining the purchase_id and user_id columns, you'll ascertain that within each window, each purchase and user is unique and accurately represented.
Here's how you can do it:
matched_data = matched_data.groupby(*pw.this).reduce(*pw.this)
Next, the groupby() function is used to group the data by the window_start and the page_url. Following this, the reduce() function is applied to compute the aggregate of conversions and the page visits per group. Determining the number of visits involves a simple tally for each window and page. When it comes to tracking conversions, you would count only those purchase_ids that are not set to None.
traffic_threshold = 2

conversions = (
    matched_data.groupby(pw.this.page_url, pw.this.window_start)
    .reduce(
        pw.this.page_url,
        pw.this.window_start,
        conversions=pw.reducers.sum(pw.cast(int, pw.this.purchase_id.is_not_none())),
        visits=pw.reducers.count(),
    )
    .filter(pw.this.visits >= traffic_threshold)
)
Nonetheless, to guarantee the statistical significance of the data, only product pages that receive a minimum amount of traffic will be taken into consideration. For the small dataset at hand, a traffic threshold has been established at 2 visits.
pw.debug.compute_and_print(
    conversions.filter(pw.this.window_start == view_window_start)
)
            | page_url           | window_start        | conversions | visits
^ZBCKQZA... | /products/0x04g7d5 | 2023-06-06 13:30:00 | 1           | 2
^VJ5XMJK... | /products/0x11b87b | 2023-06-06 13:30:00 | 1           | 3
Finally, you could calculate the conversion rate for each product:
results = conversions.select(
    pw.this.page_url,
    pw.this.window_start,
    conversion_rate=pw.this.conversions / pw.this.visits,
)

pw.debug.compute_and_print(results)
            | page_url           | window_start        | conversion_rate
^ZBCKQZA... | /products/0x04g7d5 | 2023-06-06 13:30:00 | 0.5
^GXDKSD3... | /products/0x04g7d5 | 2023-06-06 13:40:00 | 0.5
^0DNPPQA... | /products/0x04g7d5 | 2023-06-06 13:50:00 | 1.0
^RYYN8DD... | /products/0x04g7d5 | 2023-06-06 14:00:00 | 1.0
^E727Y7M... | /products/0x04g7d5 | 2023-06-06 14:10:00 | 1.0
^VJ5XMJK... | /products/0x11b87b | 2023-06-06 13:30:00 | 0.3333333333333333
^NT20C7A... | /products/0x11b87b | 2023-06-06 13:40:00 | 0.3333333333333333
^E85BG17... | /products/0x11b87b | 2023-06-06 13:50:00 | 0.3333333333333333
^GXT3RCT... | /products/0x11b87b | 2023-06-06 14:00:00 | 0.6666666666666666
^D7ZPED7... | /products/0x11b87b | 2023-06-06 14:10:00 | 0.5
^B5AZ4FX... | /products/0x11b87b | 2023-06-06 14:20:00 | 0.5
By printing the results, you now have a clear overview of the conversion rate for each product page within the specified time window. This powerful insight can help you understand which product pages are performing well and which ones need improvement.
And that concludes the demonstration of the comprehensive, data-driven approach to analyzing user behavior and conversion rates on your e-commerce website using Pathway Live Data Framework.
If you found this demonstration useful and want to dive deeper into Pathway Live Data Framework's capabilities, we recommend exploring tutorials about Interval Joins and Asof Joins, which are alternative ways for merging time-based datasets. As always, feel free to reach out to our community for any questions and further discussions. Happy analyzing!