Bridging Financial Data Streams: A Look at ASOF Join in Pathway Live Data Framework
This tutorial provides an in-depth exploration of ASOF joins in Pathway Live Data Framework. You will learn how to employ this feature to align stock prices and corporate events, showcasing the practicality and efficiency of ASOF joins in financial data analysis.
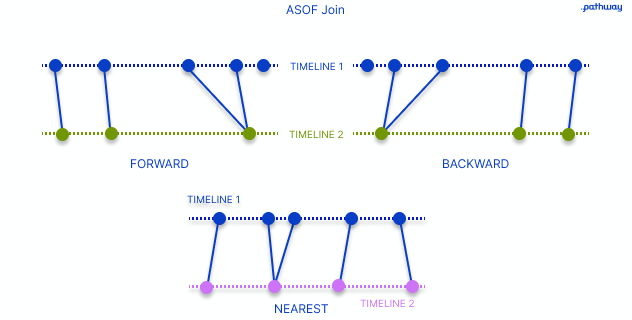
An ASOF join, is a type of join operation that combines data based on the closest preceding or succeeding timestamp. It is commonly used in realtime streaming data processing frameworks to align and correlate data based on temporal relationships. The term "ASOF" stands for "As-Of," indicating that the join operation considers data as of a specific point in time. There are three primary modes of asof join: backward, forward, and nearest.
Backward: is the default mode, it finds the last row in the other table where the time is less than or equal to the time in the current row of the self table.Forward: It finds the next row in the other table where the time is greater than or equal to the time in the current row of the self table.Nearest: This mode identifies the closest time match in the other table, whether it's in the past or future. If two times are equally distant, it defaults to the backward method.
There are few reasons that emphasize its importance:
- Temporal Alignment: Realtime data is time-stamped and is often required to be analyzed in conjunction with other time-stamped data. However, these different data streams may not always arrive at exactly the same time. An asof join enables you to combine these different data streams in a time-aware manner, aligning data points that are closest in time, even if they are not exactly the same.
- Data from Different Frequencies: Realtime data streams can come in different frequencies. For instance, one stream might be generating data every second, while another generates data every minute. An asof join can reconcile these different frequencies by joining on the most recent available data from the less frequent stream.
- Realtime Analysis: Many realtime applications, such as algorithmic trading, IoT analytics, or realtime monitoring, require asof joins to effectively combine and analyze multiple data streams in realtime. For example, in algorithmic trading, traders might need to join realtime trade data with less frequent reference data (like company earnings reports) to make immediate trading decisions.
- Resource Optimization: By performing asof joins, systems can reduce the volume of data that needs to be kept in memory for joining, because you only need to keep the most recent relevant data points. This is especially important for high-throughput realtime systems, where optimizing memory usage can significantly impact system performance and cost.
Objective: Unveiling the Impact of Events on Stock Prices
The ultimate goal in this tutorial is to unravel the impact of various corporate events on stock prices. To understand this dynamic, you will be combining two separate data sets: one containing key corporate events and the other encapsulating the corresponding stock prices for five major US companies.
However, a conventional join operation is insufficient in this context. Why? Because corporate events and stock prices don't align perfectly in time. Corporate events are sporadic, whereas stock prices fluctuate continuously throughout trading hours. To correlate these events with stock prices effectively, you'd need a more sophisticated join operation that can accurately pair an event with the closest corresponding stock price, in terms of timing.
In the scope of this tutorial, you will be leveraging data from a public API in a static mode purely for illustrative purposes. However, a more typical use-case would involve the processing of realtime data streams. In such scenarios, Pathway Live Data Framework input connectors come into play, seamlessly integrating with the remaining parts of your code to facilitate uninterrupted data flow and processing. The events data comes with dates instead of datetimes. Hence the choice of daily stock prices.
Prerequisites
For this tutorial, you would need to have Python installed along with the pandas, yahooquery, and of course, pathway libraries. If you haven't installed these yet, you can do so using pip:
%%capture --no-display
# !pip install pandas yahooquery -U pathway
Fetching the Data
kick-start this tutorial by fetching data from Yahoo Finance using the yahooquery library. You'll be looking at data for five major US companies: Apple, Google, Microsoft, Amazon, and Meta.
import pandas as pd
from yahooquery import Ticker

import pathway as pw


# Define the list of ticker symbols for the 5 major US companies
tickers = ["AAPL", "GOOGL", "MSFT", "AMZN", "META"]
start = "2023-01-01"
fmt = "%Y-%m-%d"
period = "1y"
Let's fetch the historical daily prices and corporate events data for each company.
# Instantiate Ticker object with the list of tickers
t = Ticker(tickers)

# Fetch the historical daily close prices for each company
prices = t.history(period=period, start=start).reset_index()
prices.date = pd.to_datetime(prices.date, utc=True).dt.tz_localize(None)


# Now fetch the corporate events data
events = t.corporate_events.reset_index()
Using Pathway to Process Data
The next phase involves transforming the two dataframes into Pathway Tables and calculating the Daily Return - the percentage change between the opening and closing prices for the chosen companies. This crucial step will provide us with insights into the relationship between corporate events and corresponding price fluctuations.
from datetime import datetime, timedelta

events_table = (
    pw.debug.table_from_pandas(events)
    .select(pw.this.symbol, pw.this.headline, t=pw.this.date)
    .filter(pw.this.t >= datetime.strptime(start, fmt))
)

price_table = pw.debug.table_from_pandas(prices).select(
    pw.this.symbol,
    pw.this.open,
    pw.this.close,
    daily_return=(pw.this.close - pw.this.open) / pw.this.open * 100.0,
    t=pw.this.date,
)
The table_from_pandas function converts pandas DataFrames into Pathway Live Data Framework tables. The select function is used to choose the columns you want to keep in the new tables.
Previewing Your Data
Pathway is a powerful tool designed to work with both static and real-time streaming data, though its primary strength lies in handling real-time data processing.
During the development and testing stages of your data processing pipeline, it's essential to validate that the data is processed correctly. To facilitate this, you could define a function named preview_table for data inspection. However, keep in mind that this function should not be utilized in a production setting. It employs pw.debug.compute_and_print and uses static data. For a production environment involving real-time data streams, you should rely on Pathway Live Data Framework's output connectors to access the data.
Let's take a look at the first few rows of our newly created tables.
def preview_table(table, time_col="t"):
    end = datetime.strptime("2023-01-03", fmt)
    table = table.filter(table[time_col] <= end)
    pw.debug.compute_and_print(table, include_id=False)


preview_table(events_table)
preview_table(price_table)
symbol | headline                                                                             | t
AMZN   | Amazon has secured a category-III power trading licence in India- Mint               | 2023-01-03 00:00:00
AMZN   | Amazon.com Says Term Loan Agreement Provides Co With An Unsecured $8.0 Bln Term Loan | 2023-01-03 00:00:00
symbol | open               | close              | daily_return        | t
AAPL   | 130.27999877929688 | 125.06999969482422 | -3.9990782417021253 | 2023-01-03 00:00:00
AMZN   | 85.45999908447266  | 85.81999969482422  | 0.4212504261739121  | 2023-01-03 00:00:00
GOOGL  | 89.58999633789062  | 89.12000274658203  | -0.5246049899767856 | 2023-01-03 00:00:00
META   | 122.81999969482422 | 124.73999786376953 | 1.5632618252043713  | 2023-01-03 00:00:00
MSFT   | 243.0800018310547  | 239.5800018310547  | -1.4398551808604017 | 2023-01-03 00:00:00
Applying asof_join
With your Pathway Live Data Framework tables prepared, you can now perform the asof_join operation.
merged = events_table.asof_join(
    price_table,
    events_table.t,
    price_table.t,
    events_table.symbol == price_table.symbol,
    how=pw.JoinMode.LEFT,
    direction=pw.temporal.Direction.FORWARD,
).select(
    symbol=events_table.symbol,
    headline=events_table.headline,
    daily_return=price_table.daily_return,
    event_t=events_table.t,
    price_t=price_table.t,
)

preview_table(merged, time_col="event_t")
symbol | headline                                                                             | daily_return       | event_t             | price_t
AMZN   | Amazon has secured a category-III power trading licence in India- Mint               | 0.4212504261739121 | 2023-01-03 00:00:00 | 2023-01-03 00:00:00
AMZN   | Amazon.com Says Term Loan Agreement Provides Co With An Unsecured $8.0 Bln Term Loan | 0.4212504261739121 | 2023-01-03 00:00:00 | 2023-01-03 00:00:00
In the above asof_join function call, you're joining the events table with the prices table. Let's break down its parameters:
other:Table, This is the table that will be joined with the main table (events_table in our case). In our context, this is price_table.self_timeandother_time:ColumnExpression, These are the time-like columns in both the self and other tables used as the basis for the join. In our example,events_table.tandprice_table.trespectively.*on:ColumnExpression: This represents the list of column expressions that specify the conditions for the join. In our case, we useevents_table.symbol == price_table.symbolto ensure we're matching events and prices for the same company.how:JoinMode: This sets the join mode, which can beLEFT,RIGHT, orFULL.JoinMode.LEFTis chosen to retain all rows fromevents_tableand attach corresponding data fromprice_tablewhere available.defaults:Dict[ColumnReference, Any]: This dictionary maps columns to default values for cases where the join operation doesn't find a match in the other table.direction:Direction: The direction of the join, eitherBACKWARD,FORWARD, orNEAREST. We setdirection=Direction.FORWARDto find the closest subsequent match inprice_tablefor each row inevents_table. This choice aligns with our goal of understanding the future impact of events on stock prices.
Filtering the Data
First you will filter out the rows where the time difference between the event and the price is greater than 3 days.
filtered = merged.filter(merged.price_t.is_not_none()).filter(
    pw.this.price_t - pw.this.event_t <= timedelta(days=3)
)

preview_table(filtered, time_col="event_t")
symbol | headline                                                                             | daily_return       | event_t             | price_t
AMZN   | Amazon has secured a category-III power trading licence in India- Mint               | 0.4212504261739121 | 2023-01-03 00:00:00 | 2023-01-03 00:00:00
AMZN   | Amazon.com Says Term Loan Agreement Provides Co With An Unsecured $8.0 Bln Term Loan | 0.4212504261739121 | 2023-01-03 00:00:00 | 2023-01-03 00:00:00
Now let's filter for the events with the highest impact and display the resulting table:
threshold = 3.0

highest_impact_events = filtered.filter(
    pw.apply_with_type(lambda x: abs(x) >= threshold, bool, pw.this.daily_return)
).select(
    pw.this.symbol,
    pw.this.headline,
    pw.this.daily_return,
    event_t=pw.this.event_t.dt.strftime(fmt),
)

pw.debug.compute_and_print(highest_impact_events, include_id=False)
symbol | headline                                                                                                             | daily_return        | event_t
AMZN   | Amazon Announces Record-Breaking Sales For 2024 Prime Day Event                                                      | -3.0803293690045126 | 2024-07-18
AMZN   | Amazon Plans To Launch Ad Tier For Prime Video Streaming Service - WSJ                                               | -4.55082173221072   | 2023-06-07
AMZN   | Amazon Q1 EPS USD 0.98                                                                                               | -3.362966735350458  | 2024-04-30
AMZN   | Amazon Q1 EPS USD 0.98                                                                                               | -3.362966735350458  | 2024-04-30
AMZN   | Amazon Reports CEO Andy Jassy 2022 Total Compensation Of $1.3 Mln                                                    | 3.4866141324302555  | 2023-04-13
AMZN   | Amazon To Launch Discount Section With Direct Shipping From China - The Information                                  | 3.5790726016162138  | 2024-06-26
AMZN   | Amazon Web Services Plans To Invest $35 Billion In Virginia Data Centres By 2040 - Governor Of Virginia Statement    | 3.6117615252546287  | 2023-01-20
AMZN   | Amazon.Com Confident About Plans To Lower Costs, Reduce Delivery Times                                               | 3.4866141324302555  | 2023-04-13
AMZN   | Miller Value Partners' Bill Miller III Says Personally Shorted More Tesla Today, Bought More Amazon – CNBC Interview | 3.6733748001912723  | 2023-01-06
AMZN   | On Second Day Of U.S. Prime Day Event, Consumers Spent $7 Billion Online - Adobe Report                              | -3.0803293690045126 | 2024-07-18
AMZN   | Twitch CEO Emmett Shear To Resign As CEO - Tweet                                                                     | 4.4804187107335185  | 2023-03-16
GOOGL  | Alphabet CFO Ruth Porat Expects Quarterly Capex To Be Roughly Around Q1 Level Of $12 Bln - Conf Call                 | 3.085969809317067   | 2024-04-25
GOOGL  | Alphabet Q1 EPS USD 1.89                                                                                             | 3.085969809317067   | 2024-04-25
GOOGL  | Alphabet Q1 EPS USD 1.89                                                                                             | 3.085969809317067   | 2024-04-25
META   | Meta CEO Zuckerberg says there is 'more we can do' to improve productivity, speed and cost structure                 | 3.4384897519856628  | 2023-02-01
META   | Meta Misses Q4 EPS Estimates                                                                                         | 3.4384897519856628  | 2023-02-01
META   | Meta Misses Q4 EPS Estimates                                                                                         | 3.4384897519856628  | 2023-02-01
META   | Meta Platforms Inc Says Expect Full-Year 2023 Total Expenses To Be In Range Of $86 Bln to $92 Bln                    | 3.433203101899149   | 2023-03-14
META   | Meta Reports Fourth Quarter And Full Year 2022 Results                                                               | 3.4384897519856628  | 2023-02-01
META   | Meta posts Q3 EPS USD 4.39                                                                                           | -3.3774197486139115 | 2023-10-25
META   | Meta posts Q3 EPS USD 4.39                                                                                           | -3.3774197486139115 | 2023-10-25
Conclusion
And there you have it! By using the asof_join in Pathway, you have efficiently combined realtime stock price data with corporate event data for multiple companies. This can provide valuable insights for financial analysis. As you can see, Pathway Live Data Framework provides a powerful framework for managing and manipulating time-series data.
Thank you for following this tutorial, and we hope you've found it valuable. As always, we welcome your questions and feedback.