Pathway Web Dashboard
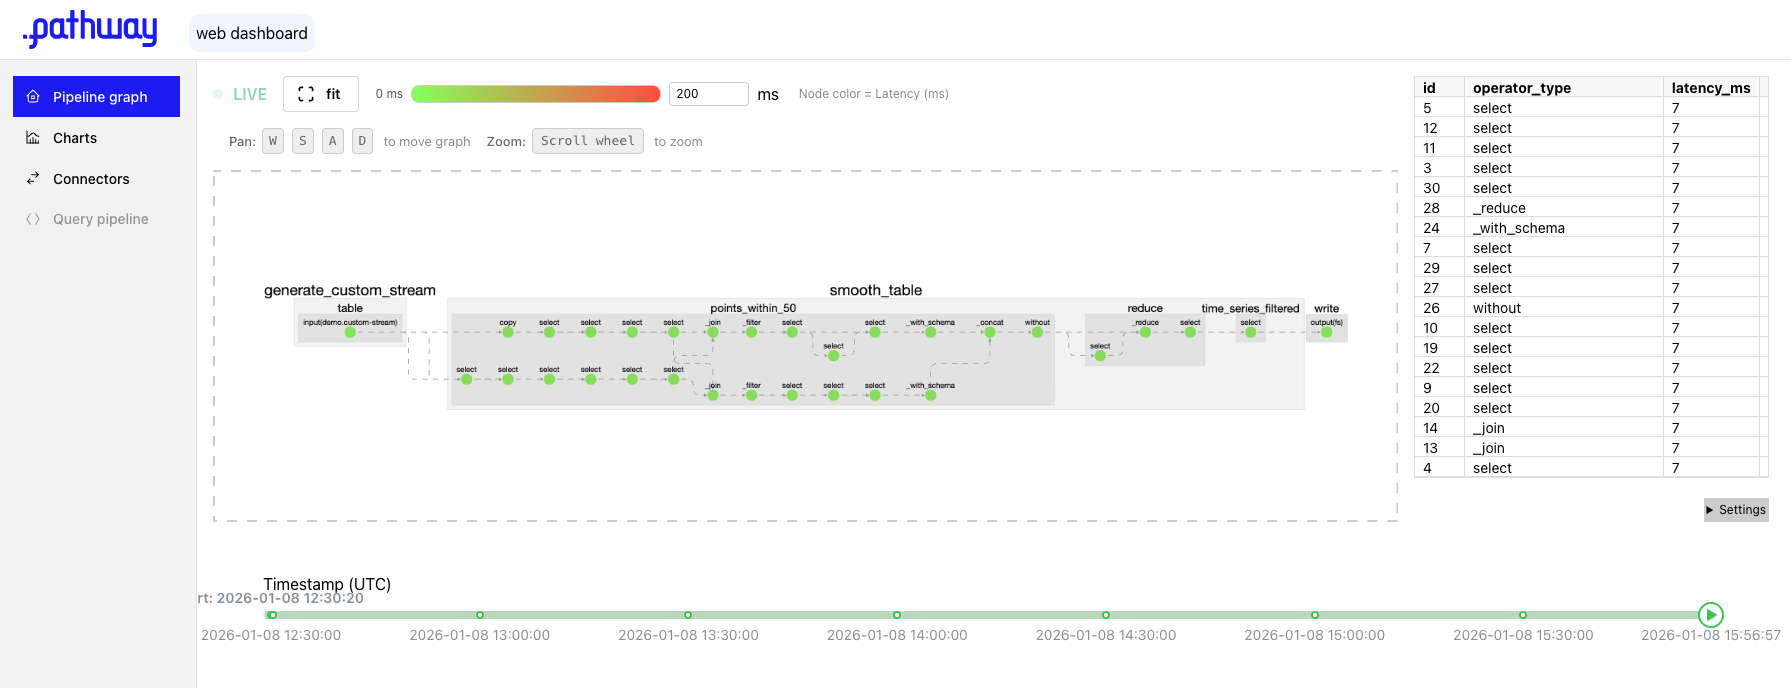
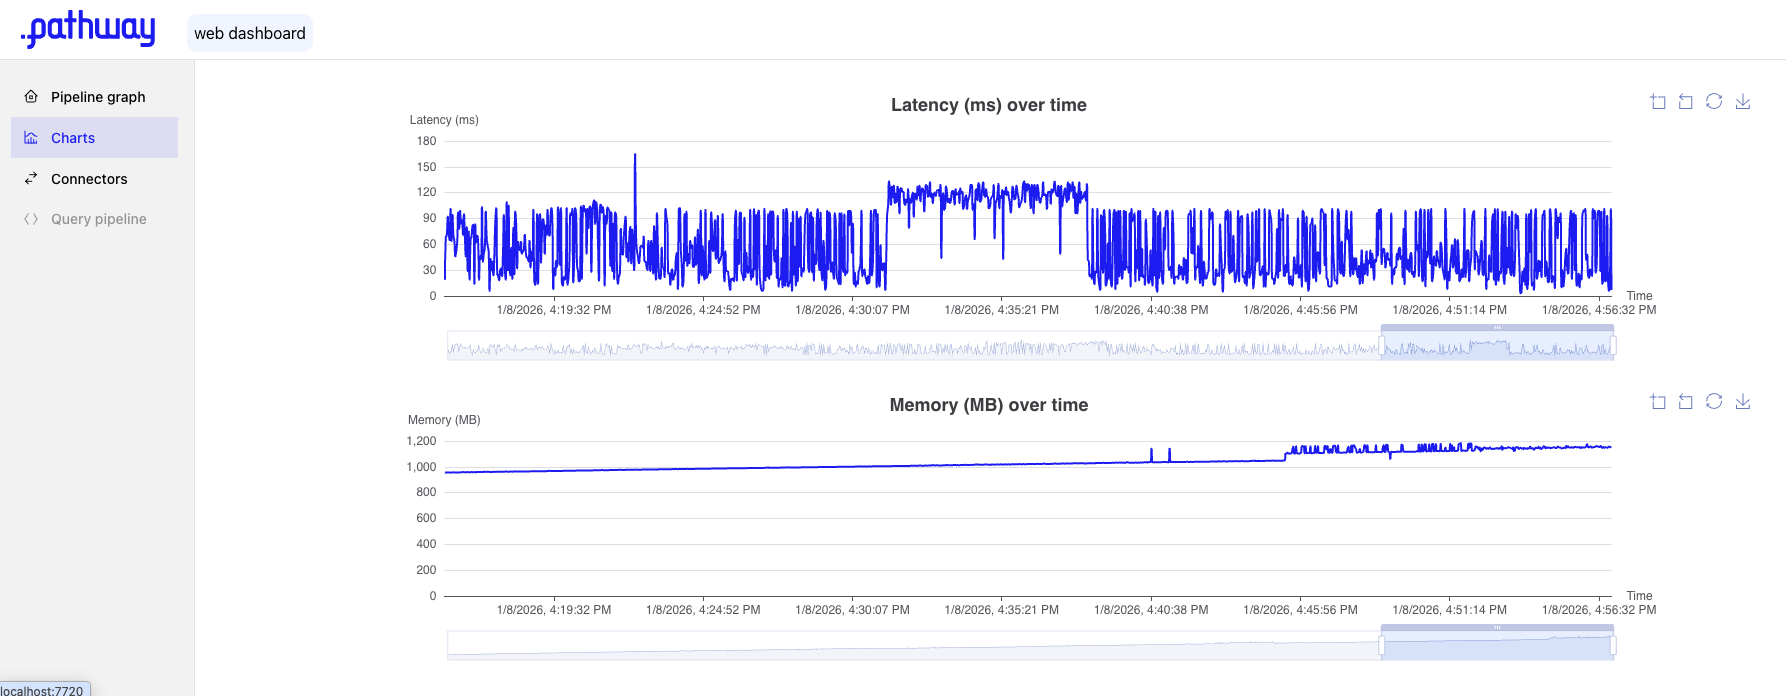
The built-in Pathway Web Dashboard provides a user-friendly interface for monitoring your data pipelines in real time. With interactive pipeline graph plotting, charts and metrics, you can easily track pipeline performance, inspect data flow, and identify bottlenecks. This guide will walk you through the setup and usage of the dashboard to help you get the most out of your Pathway deployment.

⚠️ Web Dashboard requires a Pathway Scale license.
To obtain a free license, please visit the Get License page.
Quickstart
- Add to your pipeline
pw.set_monitoring_config(detailed_metrics_dir="YOUR-DIR"), e.g.:
import pathway as pw

pw.set_license_key(key="YOUR-KEY")
pw.set_monitoring_config(detailed_metrics_dir=".")

# your pipeline here...

pw.run()
- Run your pipeline as usual
python your_pipeline.pyor usingpathway spawn.
use
PATHWAY_METRICS_READER_INTERVAL_SECONDS environment variable to configure frequency of metrics, e.g. run with
PATHWAY_METRICS_READER_INTERVAL_SECONDS=1 python your_pipeline.py- Open the dashboard
pathway web-dashboard
Features
- Advanced data flow inspection over the operator graph
- Latency tracking for each operator
- Memory usage tracking to monitor resource consumption
