Realtime Server Log Monitoring: nginx + Filebeat + Pathway

 Olivier Ruas
Realtime Server Log Monitoring: nginx + Filebeat + Pathway Live Data Framework
Monitor your server logs with the Pathway Live Data Framework. Process your logs and the Pathway Live Data Framework will automatically update the results for you. You can do anomaly detection and trigger alerts whenever too many connections happen at once and send an alert directly to Slack.

Logs are an essential component of any system or application, providing valuable information about its performance, usage, and errors. However, monitoring logs can be a time-consuming and tedious task, especially when dealing with large volumes of data. Fortunately, the Pathway Live Data Framework can help you to process your logs and produce high value insights from those, such as doing anomaly detections.

In this article, you'll explore how to monitor your server logs, such as Nginx logs, using the Pathway Live Data Framework.
Short version
Let's consider a simple scenario: you want to monitor logs and want to send a trigger whenever more than 5 logs are received during the last second.
You can compute a sliding window on a table with a timestamp column timestamp, and output the alert to a dedicated Slack channel by doing the following:
import pathway as pw
import requests
from datetime import timedelta

alert_threshold = 5
sliding_window_duration = timedelta(seconds=1)


SLACK_ALERT_CHANNEL_ID = "XXX"
SLACK_ALERT_TOKEN = "XXX"

rdkafka_settings = {
    "bootstrap.servers": "kafka:9092",
    "security.protocol": "plaintext",
    "group.id": "0",
    "session.timeout.ms": "6000",
}

inputSchema = pw.schema_builder(
    columns={
        "@timestamp": pw.column_definition(dtype=str),
        "message": pw.column_definition(dtype=str),
    }
)


# We use the Kafka connector to listen to the "logs" topic
# We only need the timestamp and the message
log_table = pw.io.kafka.read(
    rdkafka_settings,
    topic="logs",
    format="json",
    schema=inputSchema,
    autocommit_duration_ms=100,
)
log_table = log_table.select(timestamp=pw.this["@timestamp"], log=pw.this.message)
log_table = log_table.select(
    pw.this.log,
    timestamp=pw.this.timestamp.dt.strptime("%Y-%m-%dT%H:%M:%S.%fZ"),
)

# A sliding window is computed based on log_table using the timestamp
t_sliding_window = log_table.windowby(
    log_table.timestamp,
    window=pw.temporal.sliding(
        hop=timedelta(milliseconds=10), duration=sliding_window_duration
    ),
    behavior=pw.temporal.common_behavior(
        cutoff=timedelta(seconds=0.1),
        keep_results=False,
    ),
).reduce(timestamp=pw.this._pw_window_end, count=pw.reducers.count())

# There is an alert if there are more than alert_threshold logs in the window
t_alert = t_sliding_window.reduce(count=pw.reducers.max(pw.this.count)).select(
    alert=pw.this.count >= alert_threshold
)


# on_alert_event defines the behavior of the Slack channel when the alert is received
def on_alert_event(key, row, time, is_addition):
    alert_message = "Alert '{}' changed state to {}".format(
        row["alert"],
        "ACTIVE" if is_addition else "INACTIVE",
    )
    requests.post(
        "https://slack.com/api/chat.postMessage",
        data="text={}&channel={}".format(alert_message, SLACK_ALERT_CHANNEL_ID),
        headers={
            "Authorization": "Bearer {}".format(SLACK_ALERT_TOKEN),
            "Content-Type": "application/x-www-form-urlencoded",
        },
    ).raise_for_status()


# The alert table is connected to the Slack channel with the output connector
pw.io.subscribe(t_alert, on_alert_event)

time.sleep(5)
# Launching the computation.
pw.run()
How to monitor logs
Let's consider the following scenario: you have a Nginx server and you want to monitor the associated logs. You have set up a standard ELK stack: you monitor your logs with Filebeat, forwarding the updates to ElasticSearch via Logstash.

You would like to use the Pathway Live Data Framework to have a more reactive monitoring: you want to trigger an alert every time the server has more than 5 connections within a 1-second window. You need to insert the Pathway Live Data Framework between Logstash and ElasticSearch. Let's call it scenario #1.

For even better reactivity, you want to get rid of intermediate steps. You want to connect the Pathway Live Data Framework directly to Filebeat and you output the alerts from the Pathway Live Data Framework to your dedicated Slack channel. Let's call it scenario #2.

In this article, you will learn how to set up both architectures. The end results are available in our public repositories (scenario #1 and scenario #2).
Note that, for now, the Pathway Live Data Framework does not have a connector for Logstash nor Filebeat: the messages are forwarded to a Kafka instance. More connectors will be available in the future, you can check our connector catalog to discover all the available connectors with the Pathway Live Data Framework. If you are not using the ELK stack, connectors to Prometheus and Grafana are underway. A unique container with Kafka and the Pathway Live Data Framework is also coming soon.
Docker containers
Instead of installing all the required services (Filebeat, Logstash, etc.) you will use Docker containers. Docker is a powerful tool that allows you to package your application and its dependencies into a portable container that can be easily deployed and run on any platform. By using Docker, you have a consistent and reliable environment, regardless of your operating system or configuration. Docker provides a pre-configured container with all the necessary dependencies, saving you time and frustration by eliminating the need to manually install and configure all the services yourself.
Docker-compose allows you to use several containers simultaneously.
You can set up docker-compose by using a docker-compose.yml at the root of the project.
Such a file is organized as follows:
version: "3.7"
services:
  filebeat:
    build:
    environment:
    volumes:
  logstash:
    build:
    ...
Each application, called a "service" here, is defined with all its relevant parameters, for example, parameters in build define how to build the container (which image and so on).
Note that filebeat here is the name given to the service, not the name of the used image: the image is determined by the build parameter.
Plugging in Pathway to your server
Setting up Filebeat and Logstash
You need to set up both Filebeat and Logstash to monitor the logs and forward the logs to Pathway via a Kafka instance.
In the docker-compose.yml, you need to configure both services:
services:
  filebeat:
    build:
      context: .
      dockerfile: ./filebeat-src/Dockerfile
    links:
      - logstash:logstash
    depends_on:
      - logstash
  logstash:
    image: docker.elastic.co/logstash/logstash:8.6.2
    volumes:
    - ./logstash-src/logstash.conf:/usr/share/logstash/pipeline/logstash.conf
    ports:
      - 5044:5044
For Filebeat, you will use both a Dockerfile and a configuration file.
The Dockerfile will copy the configuration file in the container to configure the input/output of Filebeat.
It can also copy a script generate_input_stream.sh to generate an artificial log stream.
FROM docker.elastic.co/beats/filebeat:8.6.1

COPY ./filebeat-src/filebeat.docker.yml /usr/share/filebeat/filebeat.yml
COPY ./filebeat-src/generate_input_stream.sh /usr/share/filebeat/generate_input_stream.sh
USER root

RUN mkdir /input_stream/
RUN touch /input_stream/example.log

RUN chown root:filebeat /usr/share/filebeat/filebeat.yml
RUN chmod go-w /usr/share/filebeat/filebeat.yml
The configuration file is used to set the directory to monitor (/input_stream/* in our example) and how to output the logs (to Logstash here):
filebeat.inputs:
- type: filestream
  id: my-logs
  paths:
    - /input_stream/*

filebeat.config.modules:
  path: /usr/share/filebeat/modules.d/
  reload.enable: false

output.logstash:
  enabled: true
  hosts: ["logstash:5044"]
For simplicity, this example has no authentication mechanism. To learn how to configure the Logstash plugin of Filebeat, you can take a look at the official documentation.
Logstash will send messages to Kafka: you need to use the Kafka plugin of Logstash. You need to specify the topic and the format of the Logstash messages. In this example the topic is "logs" and Filebeat formats the updates as JSON messages, so you want to keep the same format for the output:
input {
  beats {
    port => 5044
  }
}

output {
    kafka {
        codec => json
        topic_id => "logs"
        bootstrap_servers => "kafka:9092"
        key_serializer => "org.apache.kafka.common.serialization.StringSerializer"
        value_serializer => "org.apache.kafka.common.serialization.StringSerializer"
    }
}
Similarly to Filebeat, Logstash requires a configuration file to specify the input and output. If you want to use one, you can read the official documentation of the Kafka plugin of Logstash, or this article. In our case, the input is Filebeat (which is an element of the Beats agents) on port 5044. The port is specified in the output section of the configuration file of Filebeat and it has to be also opened in the docker-compose file. To send the output to Pathway, you will use a Kafka instance as an intermediate.
Generating the logs
If you don't have a real server to monitor or simply don't have enough traffic to trigger warnings, you can generate an artificial dataset. Here is a small script that creates logs in the directory monitored by Filebeat. To simulate an important spike in traffic, it creates 1 log per second for 100 seconds and then creates 100 logs in 1 second.
#!/bin/bash

src="../../../input_stream/example.log"

sleep 1

for LOOP_ID in {1..100}
do
    printf "$LOOP_ID\n" >> $src
    sleep 1
done
for LOOP_ID in {101..200}
do
    printf "$LOOP_ID\n" >> $src
    sleep 0.01
done
This script should be included in the ./filebeat-src/ directory and should be copied by the Dockerfile in the container of Filebeat.
Nginx logs
Nginx is a popular web server and reverse proxy server used by many organizations to host their web applications. Monitoring Nginx logs is a standard use case for Filebeat. The previous configuration should work with Nginx logs: you only need to specify the directory of the Nginx logs. However, Filebeat also has a dedicated plugin for Nginx: if you want to learn more about it, take a look at the official documentation.
Connecting Pathway
Currently, there is no input connector to directly connect the Pathway Live Data Framework to Filebeat nor Logstash. You need to set up a Kafka instance to relay the messages to the Pathway Live Data Framework. Hopefully, this is easily done using a Docker container.
Kafka
You need a Kafka instance to be a gateway between Logstash and the Pathway Live Data Framework. Kafka itself relies on ZooKeeper, so you will also need a container for ZooKeeper. Hopefully, it is very easy by using Docker containers:
  zookeeper:
    image: confluentinc/cp-zookeeper:5.5.3
    environment:
      ZOOKEEPER_CLIENT_PORT: 2181
  kafka:
    image: confluentinc/cp-enterprise-kafka:5.5.3
    depends_on: [zookeeper]
    environment:
      KAFKA_ZOOKEEPER_CONNECT: "zookeeper:2181"
      KAFKA_ADVERTISED_LISTENERS: PLAINTEXT://kafka:9092
      KAFKA_BROKER_ID: 1
      KAFKA_OFFSETS_TOPIC_REPLICATION_FACTOR: 1
      KAFKA_JMX_PORT: 9991
    ports:
    - 9092:9092
    command: sh -c "((sleep 15 && kafka-topics --create --zookeeper zookeeper:2181 --replication-factor 1 --partitions 1 --topic logs)&) && /etc/confluent/docker/run "
The command line waits for the setup of the containers before creating the topic logs and then runs Kafka.
If you want to use another topic, modify this line by replacing logs with the topic you want to use.
That's all you need to do for Kafka.
Pathway Live Data Framework pipeline container
Now let's set up the container for the Pathway Live Data Framework. The Pathway Live Data Framework does not have its own docker image, so you are going to use a Dockerfile to configure our container. In the docker-compose file, you need to specify the Dockerfile you will use:
  pathway:
    build:
      context: .
      dockerfile: ./pathway-src/Dockerfile
    depends_on: [kafka, logstash]
In our Dockerfile, you only need a Python image.
You can simply install the pathway package with the pip install command:
FROM --platform=linux/x86_64 python:3.10

RUN pip install -U pathway
RUN pip install python-dateutil
COPY ./pathway-src/alerts.py alerts.py

CMD ["python", "-u", "alerts.py"]
⚠️ For compatibility reasons, a x86_64 Linux container is used.
You also need to install the dateutil package.
To obtain the logs, you now need to set the input Kafka connector.
In addition to rdkafka settings, you need to connect to the Kafka instance and listen to the topic "logs" using the topic parameter.
Then, you need to define the schema of the input data. The JSON created by Filebeat and forwarded by Logstash to Kafka has two columns of interest: "@timestamp" and "message" which are self-explanatory. The other entries contain meta-data created by Filebeat and can be discarded for our example. So you need to declare a schema with only the two columns "@timestamp" and "message": the other columns will ignored. Because of the special character in the column name "@timestamp", we opt for the inline definition to define the schema instead of the class definition.
If you want more information about the Kafka input connector, check out the dedicated tutorial.
import pathway as pw

rdkafka_settings = {
    "bootstrap.servers": "kafka-server:9092",
    "security.protocol": "sasl_ssl",
    "sasl.mechanism": "SCRAM-SHA-256",
    "group.id": "$GROUP_NAME",
    "session.timeout.ms": "6000",
    "sasl.username": "username",
    "sasl.password": "password",
}

inputSchema = pw.schema_builder(
  columns={
    '@timestamp': pw.column_definition(dtype=str),
    'message': pw.column_definition(dtype=str)
  }
)

log_table = pw.io.kafka.read(
    rdkafka_settings,
    topic="logs",
    format="json",
    schema=inputSchema,
    autocommit_duration_ms=100,
)
You now have a table with the wanted columns.
You should rename the @timestamp column to timestamp to be able to use the dot notation of the Pathway Live Data Framework.
For consistency, you also could want to rename the column message to log.
Also, Filebeat uses timestamps in the ISO 8601 format: you need to translate them into DateTime to facilitate the computation of the elapsed time between two different logs.
The Pathway Live Data Framework provides a DateTime API to manipulate datetimes and timestamps.
Those two transformations can be done easily in the Pathway Live Data Framework in a few lines:
log_table = log_table.select(timestamp=pw.this["@timestamp"], log=pw.this.message)
log_table = log_table.select(
    pw.this.log,
    timestamp=pw.this.timestamp.dt.strptime("%Y-%m-%dT%H:%M:%S.%fZ"),
)
Your log_table table is now ready to be processed!
Connecting to Filebeat directly (scenario #2)
If you don't need Logstash and want to connect directly Pathway (via Kafka) to Filebeat, you need to update the docker-compose file and the configuration file of Filebeat:
services:
  filebeat:
    build:
      context: .
      dockerfile: ./filebeat-src/Dockerfile
filebeat.inputs:
- type: filestream
  id: my-logs
  paths:
    - /input_stream/*

filebeat.config.modules:
  path: /usr/share/filebeat/modules.d/
  reload.enable: false

output.kafka:
  enabled: true
  hosts: ["kafka:9092"]
  topic: "logs"
  group_id: 1
  ssl.enabled: false
As previously, no authentication mechanism is used. If you want to use one, check out the documentation of the Kafka plugin.
Processing your logs in real time with sliding windows
Windows
In order to do realtime statistical analysis in streaming systems, such as realtime server monitoring, only the most recent data is considered. Only the most relevant data is kept, i.e. the last ten minutes, and processed in order to detect anomalies or changes in data patterns over time. This portion of the data is called a window. Windows techniques are widely used in stream data processing to analyze and summarize data over a fixed period of time.
A window is a fixed-size buffer that moves through the data stream at regular intervals, typically in a sliding or overlapping manner. As the window moves through the data stream, it collects and processes a fixed number of data items or a fixed duration of data.
The two main windows techniques that are commonly used in stream data processing, are:
- Tumbling windows: A tumbling window divides the data stream into fixed-size, non-overlapping time intervals. Each window collects and processes a fixed number of data items or a fixed duration of data, after which the window is closed and a new window is opened.
- Sliding windows: A sliding window moves through the data stream in a fixed-size, overlapping manner. Each window collects and processes a fixed number of data items or a fixed duration of data, after which the window is moved forward by a fixed amount.
For realtime monitoring you would usually prefer a sliding window over tumbling ones as the latter cut the data in non-overlapping parts: a wrong cut could prevent it from detecting the pattern you are looking for.
Sliding windows consider the most recent data at the time of the computation: its efficiency will be highly dependent on the timing of the computation. The timing of the start of the window is usually defined by the user, periodically.

Sliding windows in Pathway Live Data Framework
With the Pathway Live Data Framework, you can easily make sliding windows using the windowby function. The Pathway Live Data Framework will take care of maintaining the set of windows needed for your data and updating them whenever new data arrives.
An additional advantage of using windowby is to use data forgetting mechanisms in the Pathway Live Data Framework. By specifying behavior you can inform the Pathway Live Data Framework to forget old windows and accompanying data, which gives two benefits in the log monitoring scenario:
- The existence of an alert will be calculated only based on recent windows.
- The program can run in constant memory, rather than keeping all data that arrived. You can read more about temporal behaviors in the user guide.
To use windowby, you must provide a window argument, defining the type of windows you want. For log monitoring, use sliding windows created every 10 milliseconds, each lasting 1s. As the threshold for raising an alert is based only on the number of logs, use the count reducer for aggregating data grouped in windows.
t_sliding_window = log_table.windowby(
    log_table.timestamp,
    window=pw.temporal.sliding(
        hop=timedelta(milliseconds=10), duration=sliding_window_duration
    ),
    behavior=pw.temporal.common_behavior(
        cutoff=timedelta(seconds=0.1),
        keep_results=False,
    ),
).reduce(count=pw.reducers.count())
Finally, you can create an alert table containing a single entry, whether there is an alert or not. To do that, find a maximum number of logs in any of your windows and if this is greater or equal to your threshold, set your alert to True.
t_alert = t_sliding_window.reduce(count=pw.reducers.max(pw.this.count))
t_alert = t_alert.select(alert=pw.this.count >= alert_threshold)
Whenever a new data point is received, each table is updated: old windows are left out if they are older than the cutoff and whenever the number of kept entries is higher than the threshold the alert value is set to true.
Sending the output
Using the output connectors, you can output the results to your favorite data storage. You may want to send your statistics about your traffic to ElasticSearch or send alert messages directly to your Slack for better reactivity.

Scenario #1: sending the data to ElasticSearch
If you want to use ElasticSearch, you need an instance. You can easily set up a container for ElasticSearch:
  elasticsearch:
    image: docker.elastic.co/elasticsearch/elasticsearch:8.6.2
    ports:
      - 9200:9200
    environment:
      - discovery.type=single-node
      - "ES_JAVA_OPTS=-Xms2g -Xmx2g"
      - ELASTIC_PASSWORD=password
      - xpack.security.enabled=false
    restart: unless-stopped
The default username is elastic.
No need to create the index on which the data will be added: it will be automatically created when the Pathway Live Data Framework sends the data to ElasticSearch.
To access the data, you need to wait a few seconds for the container to be ready and then you can simply type:
curl localhost:9200/alerts/_search?pretty
This command will show you the messages received on the alerts index. You can update it if you want to see another index.
Now that ElasticSearch is configured, you need to use an output connector to send the tables made by the Pathway Live Data Framework to ElasticSearch.
pw.io.elasticsearch.write(
    t_alert,
    "http://elasticsearch:9200",
    auth=pw.io.elasticsearch.ElasticSearchAuth.basic("elastic", "password"),
    index_name="alerts",
)
Note that here you cannot use the traditional localhost but the name of the service: elasticsearch.
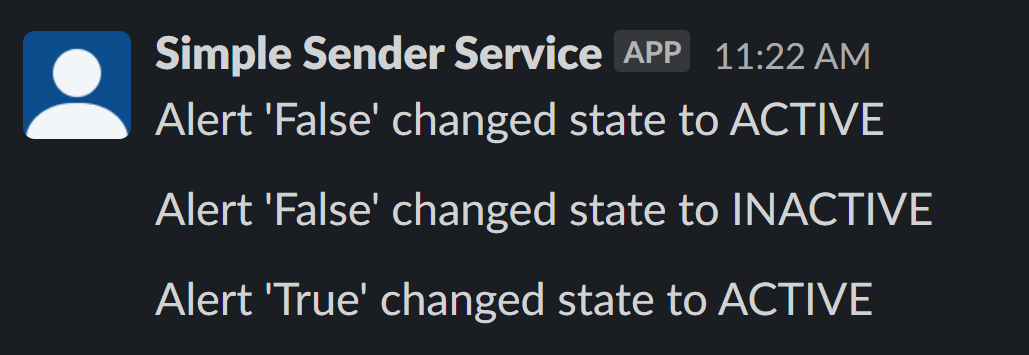
Scenario #2: sending the alert to Slack
For reactivity reasons, you may want to have alerts sent directly to a Slack channel. To do it with Pathway, you need the ID and the token of the channel:
import requests

def on_alert_event(key, row, time, is_addition):
    alert_message = "Alert '{}' changed state to {}".format(
        row["alert"],
        "ACTIVE" if is_addition else "INACTIVE",
    )
    requests.post(
        "https://slack.com/api/chat.postMessage",
        data="text={}&channel={}".format(alert_message, SLACK_ALERT_CHANNEL_ID),
        headers={
            "Authorization": "Bearer {}".format(SLACK_ALERT_TOKEN),
            "Content-Type": "application/x-www-form-urlencoded",
        },
    ).raise_for_status()


pw.io.subscribe(t_alert, on_alert_event)
You need the package requests, which should be installed in the Dockerfile:
FROM --platform=linux/x86_64 python:3.10

RUN pip install -U pathway
RUN pip install requests
RUN pip install python-dateutil
COPY ./pathway-src/alerts.py alerts.py

CMD ["python", "-u", "alerts.py"]
Your alerts will be sent directly to your Slack channel.
Putting all the pieces together
Scenario #1
Here is the final architecture for our realtime logs monitoring using Logstash and ElasticSearch:
.
├── filebeat-src/
│   ├── Dockerfile
│   ├── filebeat.docker.yml
│   └── generate_input_stream.sh
├── logstash-src/
│   └── logstash.conf
├── pathway-src/
│   ├── alerts.py
│   └── Dockerfile
├── docker-compose.yml
└── Makefile
The sources of this example are available in our public repository.
Here is the Pathway Live Data Framework implementation:
import time
from datetime import timedelta
import pathway as pw

alert_threshold = 5
sliding_window_duration = timedelta(seconds=1)

rdkafka_settings = {
    "bootstrap.servers": "kafka:9092",
    "security.protocol": "plaintext",
    "group.id": "0",
    "session.timeout.ms": "6000",
}

inputSchema = pw.schema_builder(
  columns={
    '@timestamp': pw.column_definition(dtype=str),
    'message': pw.column_definition(dtype=str)
  }
)

log_table = pw.io.kafka.read(
    rdkafka_settings,
    topic="logs",
    format="json",
    schema=inputSchema,
    autocommit_duration_ms=100,
)
log_table = log_table.select(timestamp=pw.this["@timestamp"], log=pw.this.message)
log_table = log_table.select(
    pw.this.log,
    timestamp=pw.this.timestamp.dt.strptime("%Y-%m-%dT%H:%M:%S.%fZ").dt.timestamp(),
)

t_sliding_window = log_table.windowby(
    log_table.timestamp,
    window=pw.temporal.sliding(
        hop=timedelta(milliseconds=10), duration=sliding_window_duration
    ),
    behavior=pw.temporal.common_behavior(
        cutoff=timedelta(seconds=0.1),
        keep_results=False,
    ),
).reduce(timestamp=pw.this._pw_window_end, count=pw.reducers.count())

t_alert = t_sliding_window.reduce(count=pw.reducers.max(pw.this.count)).select(
    alert=pw.this.count >= alert_threshold
)

pw.io.elasticsearch.write(
    t_alert,
    "http://elasticsearch:9200",
    auth=pw.io.elasticsearch.ElasticSearchAuth.basic("elastic", "password"),
    index_name="alerts_logs",
)

time.sleep(5)

pw.run()
You may have noticed that there is a time.sleep(5) before pw.run() as you need to wait for Kafka to be ready.
Without it, it would still work, but you will have some errors in the logs because the Pathway Live Data Framework couldn't connect to Kafka.
Don't forget the pw.run(), without it no computations are done.
Scenario #2
The final architecture for our realtime logs monitoring using only Filebeat and forwarding the alerts to Slack is as follows:
.
├── filebeat-src/
│   ├── Dockerfile
│   ├── filebeat.docker.yml
│   └── generate_input_stream.sh
├── pathway-src/
│   ├── alerts.py
│   └── Dockerfile
├── docker-compose.yml
└── Makefile
The sources of this example are also available in our public repository.
Here is the full Pathway Live Data Framework implementation, from connecting to Kafka to forwarding the alert to Slack:
import time
from datetime import timedelta
import pathway as pw
import requests

alert_threshold = 5
sliding_window_duration = timedelta(seconds=1)

SLACK_ALERT_CHANNEL_ID = "XXX"
SLACK_ALERT_TOKEN = "XXX"

rdkafka_settings = {
    "bootstrap.servers": "kafka:9092",
    "security.protocol": "plaintext",
    "group.id": "0",
    "session.timeout.ms": "6000",
}

inputSchema = pw.schema_builder(
  columns={
    '@timestamp': pw.column_definition(dtype=str),
    'message': pw.column_definition(dtype=str)
  }
)


log_table = pw.io.kafka.read(
    rdkafka_settings,
    topic="logs",
    format="json",
    schema=inputSchema,
    autocommit_duration_ms=100,
)
log_table = log_table.select(timestamp=pw.this["@timestamp"], log=pw.this.message)
log_table = log_table.select(
    pw.this.log,
    timestamp=pw.this.timestamp.dt.strptime("%Y-%m-%dT%H:%M:%S.%fZ"),
)

t_sliding_window = log_table.windowby(
    log_table.timestamp,
    window=pw.temporal.sliding(
        hop=timedelta(milliseconds=10), duration=sliding_window_duration
    ),
    behavior=pw.temporal.common_behavior(
        cutoff=timedelta(seconds=0.1),
        keep_results=False,
    ),
).reduce(timestamp=pw.this._pw_window_end, count=pw.reducers.count())

t_alert = t_sliding_window.reduce(count=pw.reducers.max(pw.this.count)).select(
    alert=pw.this.count >= alert_threshold
)

def on_alert_event(key, row, time, is_addition):
    alert_message = "Alert '{}' changed state to {}".format(
        row["alert"],
        "ACTIVE" if is_addition else "INACTIVE",
    )
    requests.post(
        "https://slack.com/api/chat.postMessage",
        data="text={}&channel={}".format(alert_message, SLACK_ALERT_CHANNEL_ID),
        headers={
            "Authorization": "Bearer {}".format(SLACK_ALERT_TOKEN),
            "Content-Type": "application/x-www-form-urlencoded",
        },
    ).raise_for_status()

pw.io.subscribe(t_alert, on_alert_event)

time.sleep(5)

pw.run()
Makefile
To start, stop, and access the different containers you can use the following Makefile:
build:
    docker-compose up -d

stop:
    docker-compose down -v

connect:
    docker-compose exec filebeat bash
connect-pathway:
    docker-compose exec pathway bash
To start the generate_input_stream.sh script, you need to connect to the Filebeat container using make connect and then type:
./generate_input_stream.sh
This will create an artificial stream of logs. You can see the impact of the stream in your ElasticSearch instance or on Slack depending on the scenario you have chosen.
Conclusion
Congratulations! You can now monitor your logs in realtime. Realtime statistical analysis is a key part of realtime processing of streaming data. Such analysis is challenging and existing windows techniques are limited by the fact that they are triggered periodically, without any awareness of the events. With streaming data, there will be a time when the setting will lead to either a waste of resources or a loss in accuracy. With the Pathway Live Data Framework, you can create event-based windows, which are updated, and not computed from scratch, whenever new events are incoming. You can define your pipeline and the Pathway Live Data Framework will handle the updates for you: your sliding window will always be computed on the latest data, without missing any data point nor computing twice the same window. Last but not least, you can drink your coffee calmly in front of your screen, and get all the alerts directly in your Slack.


 Saksham Goel
 blog · tutorial · engineeringFeb 5, 2025Real-Time AI Pipeline with DeepSeek, Ollama and Pathway
 Luca Metehau
 tutorial · engineeringAug 6, 2024Computing the Option Greeks using Pathway and Databento
 Olivier Ruas
 blog · tutorial · engineering · frameworkFeb 2, 2026Real-Time OCR with PaddleOCR and Pathway Live Data Framework