Monitoring Pathway Instance
This article will guide you through setting up monitoring for your Pathway application. It will allow you to reliably oversee the execution of your streaming pipeline.
⚠️ Monitoring features require a Pathway Scale license.
To obtain a free license, please visit the Get License page.
Proper monitoring of Pathway application is inevitable for business-critical production deployment. One has to ensure that all the current and previous bottlenecks, like drops in latency and throughput or any anomalous behaviors are easily identifiable, so that all the issues can be immediately resolved.
Pathway leverages the OpenTelemetry protocol (OTLP) for gathering and sending traces, metrics, and logs which enables connecting seamlessly with various monitoring destinations, including the popular OpenTelemetry Collector.
This tutorial will show you how to set up the monitoring of a Pathway application using an OpenTelemetry Collector. The logs will be accessed using Grafana Cloud and Grafana Loki.
To follow along, you will need an OpenTelemetry Collector set up with the gRPC protocol enabled for its OTLP receiver. If you already have your OpenTelemetry Collector configured correctly, you can skip the next section, otherwise please make sure you have Docker installed.
Configuring OpenTelemetry Collector
The OpenTelemetry Collector offers various deployment options.
This tutorial focuses on an approach using Docker and the official otel/opentelemetry-collector-contrib image.
However, keep in mind there are other methods available.
You can for example use the official Helm Chart to run it on Kubernetes,
or reach for solutions like Grafana Alloy.
First, create a configuration file named config.yaml for the OpenTelemetry Collector with OTLP receiver and debug exporter.
receivers:
  otlp:
    protocols:
      grpc:

exporters:
  debug:
    verbosity: detailed
Now specify pipelines for traces, metrics and logs, adding the following snippet in the same file:
service:
  pipelines:
    traces:
      receivers: [otlp]
      exporters: [debug]
    metrics:
      receivers: [otlp]
      exporters: [debug]
    logs:
      receivers: [otlp]
      exporters: [debug]
You can now launch the server, using command below.
docker run -v config.yaml:/etc/otelcol-contrib/config.yaml -p <PORT>:4317 otel/opentelemetry-collector-contrib:latest
Make sure to replace <PORT> with the chosen port.
Enabling Pathway monitoring
Once you have your license key ready, setting up monitoring in Pathway is easy. Just copy these lines at the beginning of your pipeline. Don't forget, you can obtain your free license here.
import pathway as pw

pw.set_license_key(key="YOUR-KEY")
pw.set_monitoring_config(server_endpoint="http://localhost:<PORT>")

# your pipeline here...

pw.run()
That's it! Run your pipeline now and observe the OpenTelemetry Collector logs for collected data. You should see the first entries appear shortly.
Exploring the Data
The OpenTelemetry Collector lets you export collected data to various observability backends. Explore the OpenTelemetry documentation and the Collector's repository for more details.
This tutorial focuses on using Grafana Loki as your log destination. Grafana Cloud offers a comprehensive package that covers your monitoring needs. Once you've completed this tutorial, configuring Grafana Prometheus for metrics and Grafana Tempo for traces should be straightforward. Complete configuration example can be found in our repository.
Configuring Grafana Cloud
Create your account in the Grafana Cloud, by going to https://grafana.com/. In the organization panel, click on "Send Logs" button under Loki section. It should direct you to Loki configuration page.
Modify your config.yaml by adding configuration below. Replace <USER>, <TOKEN>, and <URL> with the information found under the "Sending Logs to Grafana Cloud" section.
Ensure that your token is generated with metrics write permissions.
# set up authorization extension
extensions:
  basicauth/grafana_cloud_loki:
    client_auth:
      username:  <USER>
      password:  <TOKEN>

# add tempo exporter with authenticator
 exporters:
  debug:
    verbosity: detailed
  loki/grafana_cloud_logs:
    endpoint: <URL>
    auth:
      authenticator: basicauth/grafana_cloud_loki


# enabled authorization extension and add exporter to the logs pipeline
service:
   extensions: [basicauth/grafana_cloud_loki]
   pipelines:
    logs:
      receivers: [otlp]
      exporters: [loki/grafana_cloud_logs, debug]
    ...
You can now restart your OpenTelemetry Collector and check Grafana Loki.
- Go to your Grafana organization portal and launch Grafana.
- Select "Explore" in the secontion on the left.
- Select
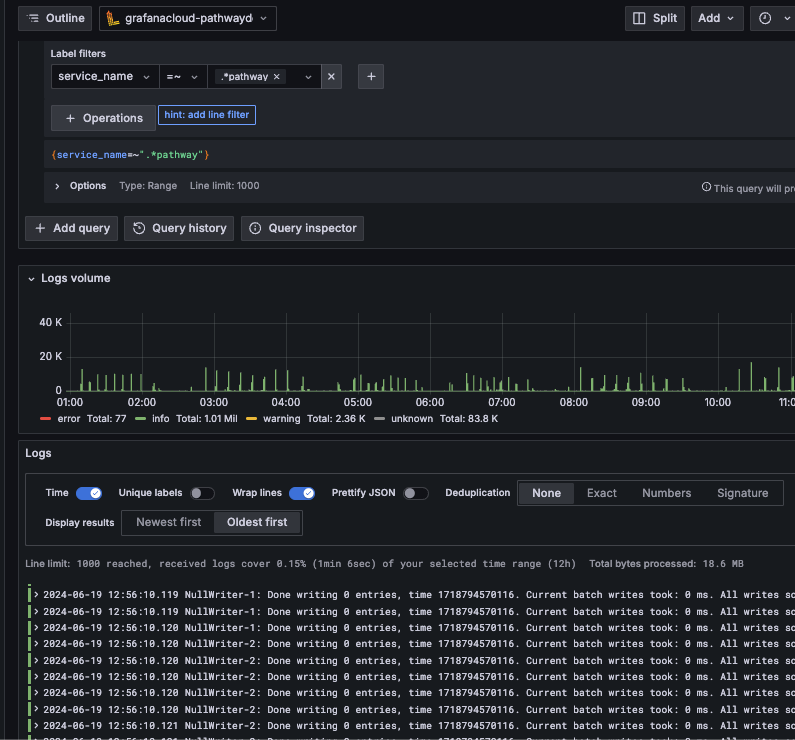
grafanacloud-<your-org>-lokisource. - Filter by label
service_name=~".*pathway"
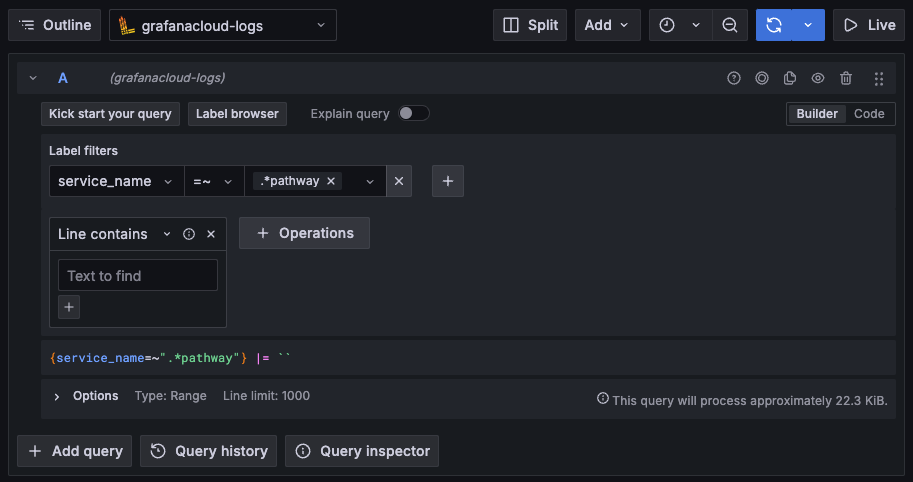
You should see the logs appearing below.
This tutorial only scratches the surface of monitoring setup but should provide a good starting point. Don't hesitate to check out our examples as well as OpenTelemetry documentation to learn more.