Pathway Tutorial for Pandas Users
This tutorial gets you up and running with Pathway in 10 minutes. It is specificaly designed for users coming from pandas.
For more advanced users, you can find a Pandas-to-Pathway cheat sheet here.
In this tutorial, you will learn how to:
- build a real-time data streaming pipeline
- process data on-the-fly as it comes into your stream
- store the processed data on disk
You'll be performing a simple sum aggregation on live data.
In pandas you would compute a sum aggregation like this:
import pandas as pd
df = pd.read_csv("input_data.csv")
df.value.sum()
This is pretty straightforward...but doesn't work with streaming data 😕 Fortunately, Pathway does! 🙌
This is the Pathway code that will solve our problem:
import pathway as pw

class InputSchema(pw.Schema):
    value: int

t = pw.io.csv.read(
  './sum_input_data/',
    schema=InputSchema
)
t = t.reduce(sum=pw.reducers.sum(t.value))
pw.io.csv.write(t, "output_stream.csv")
pw.run()
Don't worry if you don't fully understand it yet -- that's exactly what you will learn by completing this tutorial.
Install Pathway
To install the latest Pathway release, which is now available on a free-to-use license:
pip install -U pathway
You are ready to roll - let's get to it!
Get the Data into Your Stream
Let's begin by importing pathway:
import pathway as pw
Next, let's define a table. This table will contain the data that is flowing into our stream.
A table in Pathway is comparable to a DataFrame in pandas. This table is created by 'listening' to a directory for new events.
The term 'events' may be new to you if you're coming from pandas. Events are the core of data streaming architectures and it's important to understand their basic principles so that you can build effective data streaming pipelines. The next section explains some of these principles; you should feel free to skip it if you have a basic understanding of how data streaming works.

Basic Data Streaming Principles
When doing 'regular' data-processing in
pandasyou are working with a dataset that is static: all the data you will work with is available to you before you start your processing. Sure, it may need some cleaning and wrangling, but your dataset stays more or less the same.
In streaming workflows, this is very different. Data is not static but dynamic. You don't know the size or content of your dataset before you start processing: the processing happens as the data is being generated.
This means that we can't structure our processing around 'batches' of data the way we did in
pandas: the whole point of data streaming is to process data in real-time, not sit around waiting until all of the data has been collected.
So instead, data streaming pipelines are built around 'events': specific moments when something happens to our data. Common events are data being created, removed, or updated. Whenever an event happens, the data streaming pipeline is triggered and data processing starts.
In our case, we will create a Pathway table by listening to a directory for new events (in this case ./sum_input_data/) and defining the schema of the table which maps the columns to their data types. Be sure to toggle streaming mode on by setting mode to streaming.
class InputSchema(pw.Schema):
    value: int


t = pw.io.csv.read(
    "./sum_input_data/",
    schema=InputSchema,
)
Notice that we have just created a new table...without having any data yet!
t
WARNING:param.Column00133: Displaying Panel objects in the notebook requires the panel extension to be loaded. Ensure you run pn.extension() before displaying objects in the notebook.


WARNING:param.Column00133:Displaying Panel objects in the notebook requires the panel extension to be loaded. Ensure you run pn.extension() before displaying objects in the notebook.


<pathway.Table schema={'value': <class 'int'>}>

This is one of the fundamental differences between pandas and pathway. While pandas is static and requires a batch of data already available to process, a Pathway table can be created simply by pointing it in the right direction, and the table will be populated with data as it arrives.
It's as if we're saying, "Hey Pathway, keep an eye on that corner of the restaurant and whenever new people arrive, give them a seat at that table over there."
Or in more technical terms: every time a new CSV file is added into ./sum_input_data/, the content of its value column will be automatically added to the table t.
Process the Data
Now that we have a place where we can hold the data we're interested in, it's time to do something with it :)
Remember that our specific problem for this tutorial is to perform a real-time sum on live incoming data.
Let's go ahead and select the values we're interested in.
t1 = t.select(value=t.value)
The arguments to select are dynamic; you can use them to define the desired column names and then pass the content. To create a table with column name value containing the contents of the value column:
You could also name your new column something else by writing:
t2 = t.select(new_col_value=t.value)
Then let's perform a groupby on the value column using the reduce method.
Just like with select above, the argument to reduce is used to define the resulting column name (in this case sum). We pass it the result of pw.reducers.sum over the t.value column:
t = t.reduce(sum=pw.reducers.sum(t.value))
Again, notice that we are 'performing' select and reduce actions without actually having any data yet. In fact, it would be more accurate to say that we are describing actions to be taken in the future, as soon as data arrives.
What we are doing here is building the pipeline, so that when our data starts arriving it is processed correctly and ends up in the place where we want it to be. This is different from pandas in which we have all the data already and operations are executed the moment they are described. Read more about the dataflow to understand how Pathway pipelines are built under the hood.
Get the Data out of Your Stream
Now that we have built our processing pipeline, let's write the resulting data to disk and store it for future use:
pw.io.csv.write(t, "sum_output_stream.csv")
That's it! Your real-time sum data stream is all set up.
It just needs........data :)
Generate a Live Data Stream
We can simulate a live data stream by writing some code that will create a CSV file every second with some data in its value column.
Using pandas that would look something like this:
from time import sleep
import pandas as pd
sleep(10)
df = pd.DataFrame()
for loop_id in range(0,10):
    df = pd.DataFrame(data=[loop_id], columns=["value"])
    df.to_csv(f"./sum_input_data/input_table_{loop_id}.csv", )
    sleep(1)
We can then use the Pathway code we built above to listen to the sum_input_data directory and process data as it comes in:
class InputSchema(pw.Schema):
    value: int

t = pw.io.csv.read("./sum_input_data/", schema=InputSchema)
t = t.reduce(sum=pw.reducers.sum(t.value))
pw.io.csv.write(t, "output_stream.csv")
pw.run()
IMPORTANT: Make sure to always include pw.run() at the end of your Pathway script. All the steps before this command are simply defining the pipeline. pw.run() tells Pathway to actually execute it.
To be able to see the result of your work in action, let's separate the data generation and data processing code into 2 separate scripts that we can then launch simultaneously from our terminal.
While we're at it, let's convert the data generation code into bash to make it easier to clean up the directory and avoid messy overwrites:
Save the code below as generate_stream.sh:
!/bin/bash
src="./sum_input_data/"
rm -r $src
mkdir -p $src
sleep 10
for LOOP_ID in {1..30}
do
    filename=$src"input_table_$LOOP_ID.csv"
    printf "value\n$LOOP_ID\n" >> $filename
    sleep 1
done
And save the code below as perform_realtime_sum.py:
import pathway as pw
class InputSchema(pw.Schema):
    value: int

t = pw.io.csv.read("./sum_input_data/", schema=InputSchema)
t = t.reduce(sum=pw.reducers.sum(t.value))
pw.io.csv.write(t, "output_stream.csv")
pw.run()
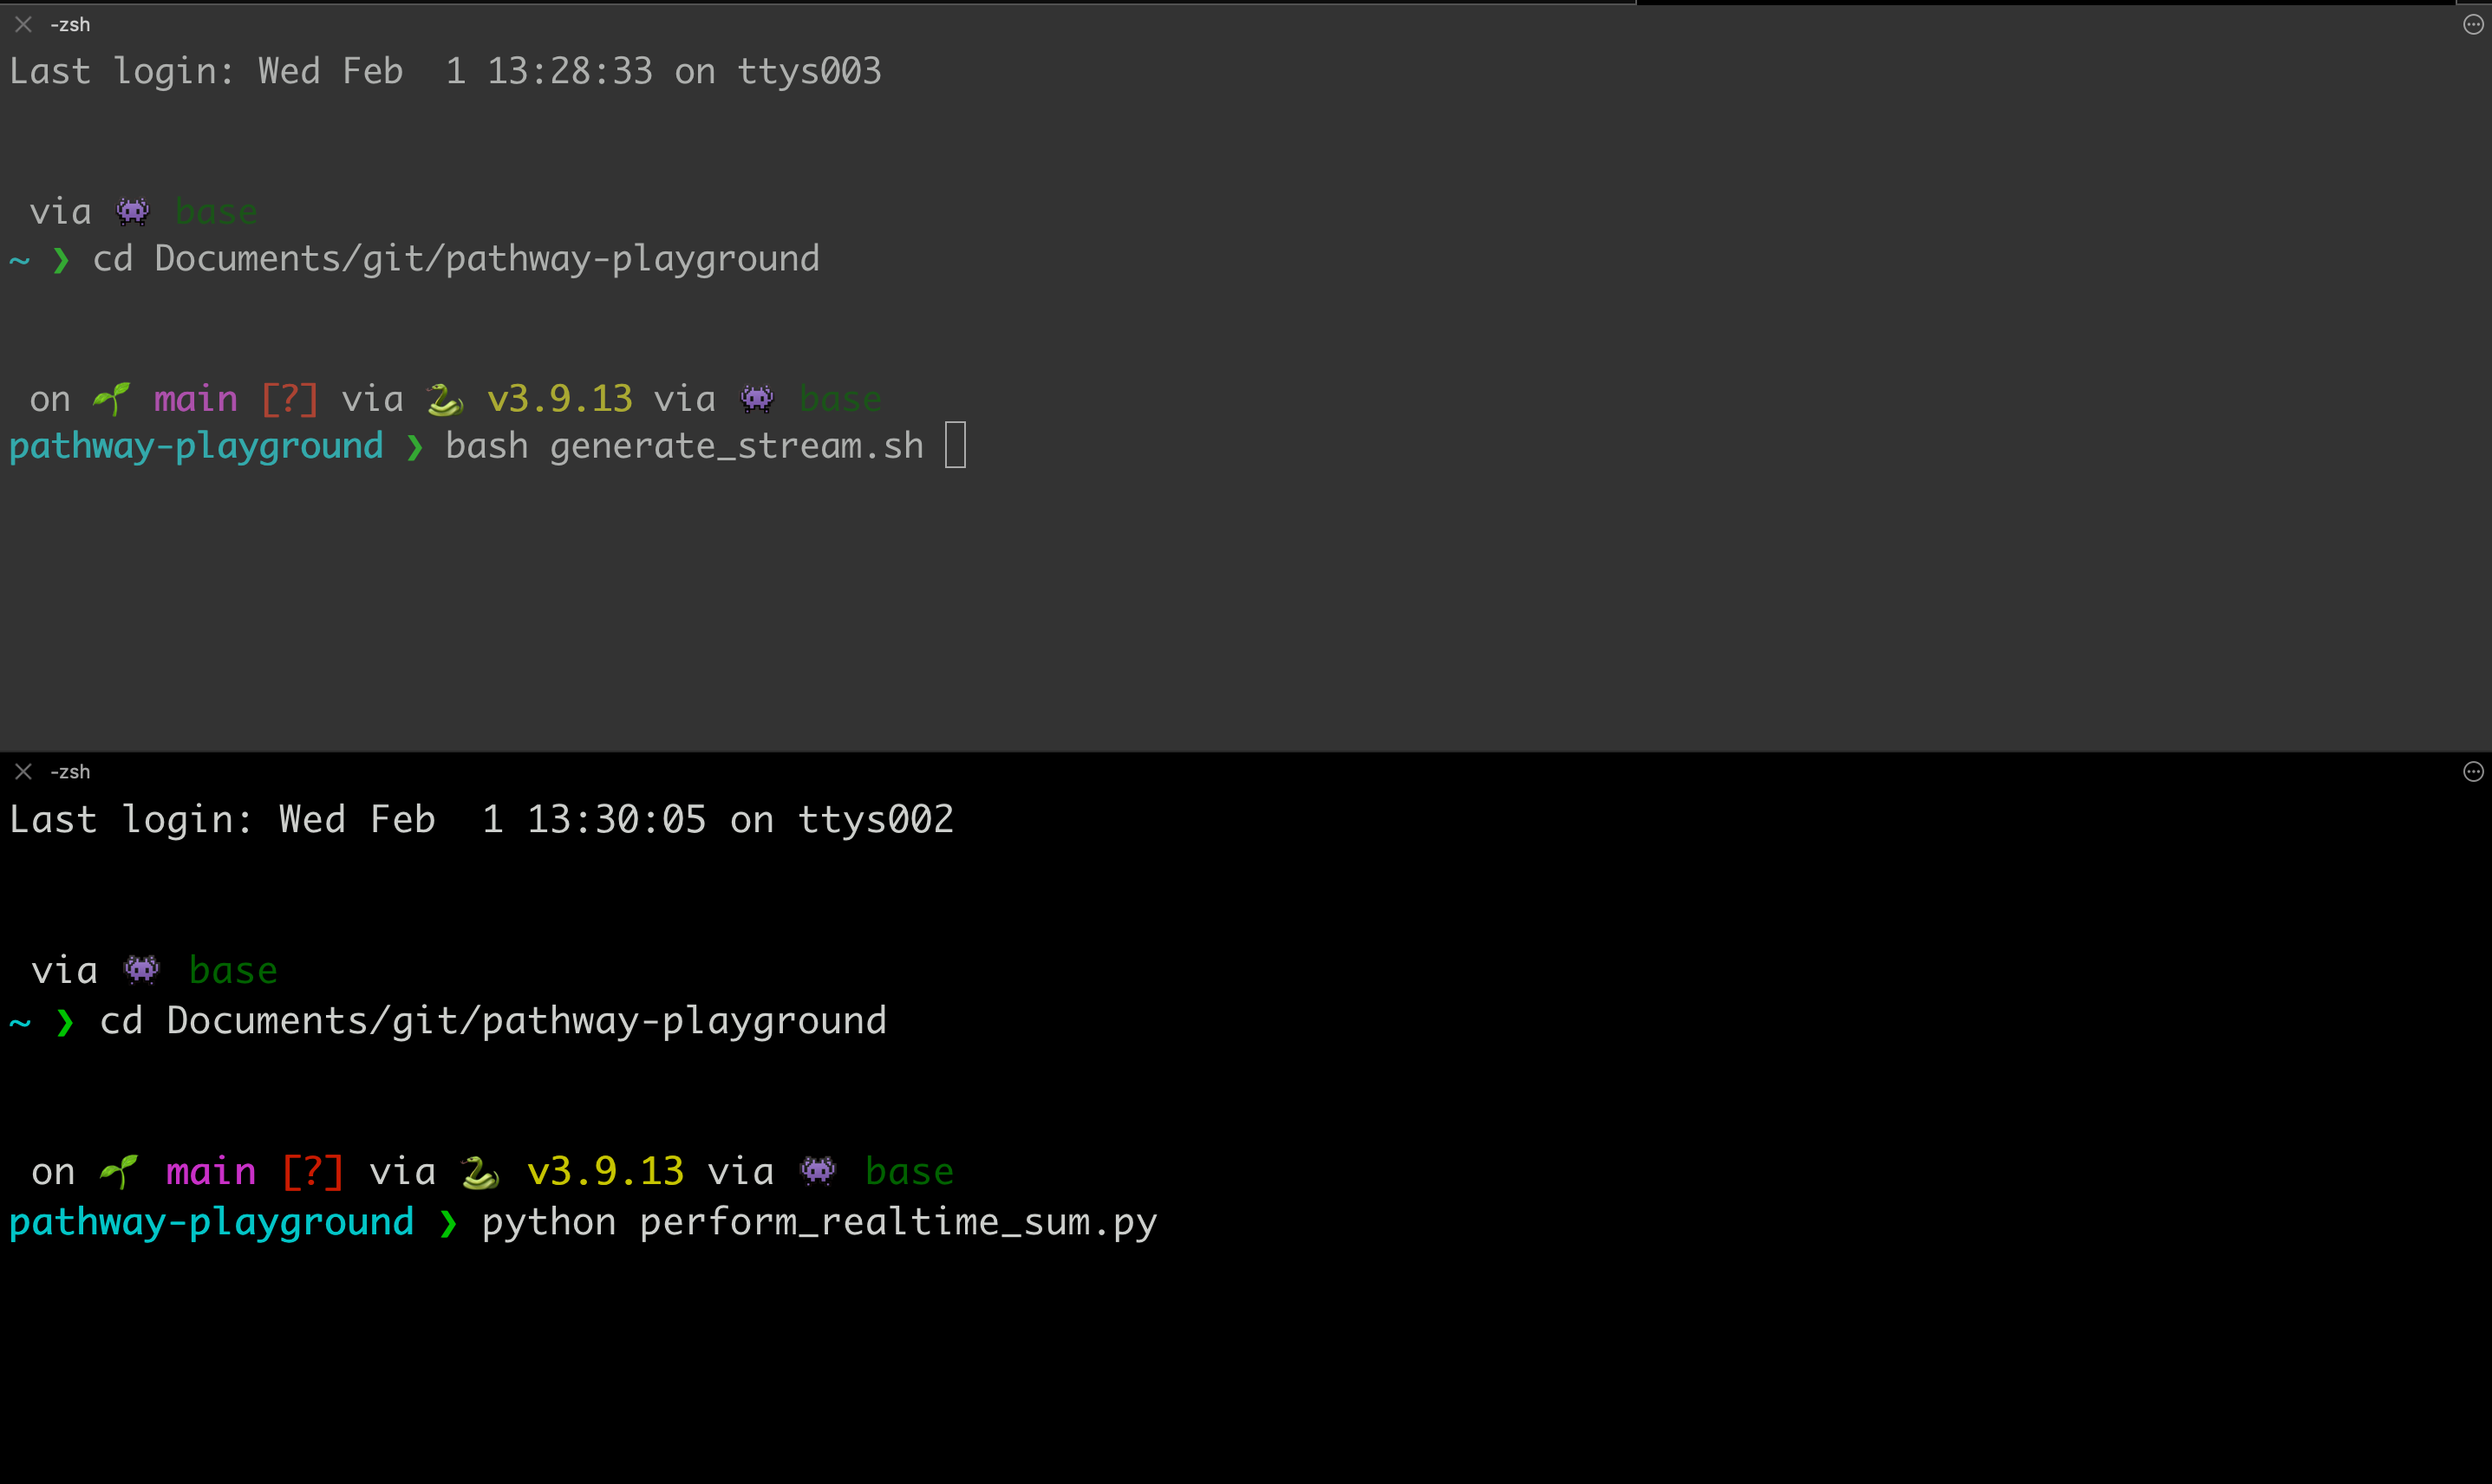
Now head over to your terminal, open two tabs / kernels and then:
- run
bash generate_stream.shin the first kernel - run
python perform_realtime_sum.pyin the second
The input connector requires the input CSV directory to exist so the script generating the stream should be launched first. The input connector will connect to the file and update the results every time a new CSV file is added, updating automatically and in real-time the output CSV file using the output CSV connector.
Interpret the Output
In streaming pipelines, there are generally 3 types of operations you can perform on your data:
- insert new data
- remove existing data
- update existing data, which is actually a combination of operation (2) and (1).
In our case, we will mostly be dealing with updates to the existing sum value. Read our guide on input and output streams to learn more.
The output of this project is a CSV file output_stream.csv in which all the operations are recorded:
import pandas as pd
output = pd.read_csv("output_stream.csv")
output.head()
| sum | time | diff | |
|---|---|---|---|
| 0 | 1 | 1675861157539 | 1 |
| 1 | 1 | 1675861157540 | -1 |
| 2 | 3 | 1675861157540 | 1 |
| 3 | 3 | 1675861157541 | -1 |
| 4 | 10 | 1675861157541 | 1 |
Let's explain what this output data means in technical terms first, then we will dive deeper with a real-world example.
Each update is represented by up to two rows. Each row contains:
- the columns of the output table, here we only have
sum. time, which represents the timestamp at which the update has happened.diff, which represents whether the row represents an addition or a deletion.
An update is represented by two rows: one to remove the old value, one to add the new values. Those two rows will have the same timestamp to ensure the correctness of the update. There is one exception: the first update is represented by a single row because there is no old value to remove.
So the first line represents the insertion (diff=1) of a new value (sum=1) which has happened at timestamp time=1675861157539.
Then a new CSV file is created containing the new value 2, changing the value of sum from 1 to 3, resulting in both the deletion (diff=-1) of the previous value (sum=1) which has happened at time=1675861157540 AND an addition (diff=1) of a new value (sum=3) at the same time.
The output file is continuously updated until the process is killed.
Real-World Example
Let's use a real-world example to illustrate the importance and value of this output.
Imagine you work for a bank. The bank stores customers' money in accounts that customers can access whenever they like. Every time a customer of the bank goes to an ATM to withdraw money from their account, the bank wants to make sure that this transaction happens correctly. They only want to give them money that's actually in their account, and then adjust the account balance to reflect the change. This means the ATM withdrawal needs to be syncronised exactly with the adjustment in the customer's account balance. In order to do this we need to know the time at which the event happened and the amount that was changed (or the diff).
In streaming settings, all the intermediate states of the data are stored during the process. This means you can access not just the final result (of sum in our case) but also each value along the way. If you are only interested in the final value, it is up to you to select it, by ordering by the time column and then selecting the latest value:
output = output.sort_values(by=["time"], ascending=False)
output.head(1)
| sum | time | diff | |
|---|---|---|---|
| 20 | 406 | 1675861187559 | 1 |
In our case, the total sum of the data is 406. Well done!
You might have noticed that in this particular example, the
sort_valuescall was a little overkill since the data is being processed in a single, sequential process and so the resulting output was already neatly ordered. In real-world streaming use cases, however, you may be dealing with multiple data sources, latency and other factors that will disturb the order of your data. In these cases, the timestamp will enable you to order the data correctly.
What's next?
Congratulations! You've just built your first realtime streaming application with Pathway.

For more Pandas-to-Pathway conversion, take a look at the cheat sheet. Now that you're up and running, consider taking trying one of our templates.
We would love to hear your feedback about our product. Come say hi on our Discord!