Smart real-time monitoring application with alert deduplication
 Mateusz Lewandowski
Smart real-time monitoring application with alert deduplication
In many monitoring environments, especially those dealing with complex systems, it's common for multiple alerts to be triggered for the same underlying issue. This creates the necessity for alert deduplication, with rules matching specific business needs. In this tutorial we will show how to design and implement such deduplication mechanism in Pathway handling real-time streaming data.
For the sake of this tutorial, let's assume we observe a simple stream of floating-point values and our business rule is to notify only whenever the maximal observed value is 30% larger than the previously alerted value.
Sample data
Let's generate some static data, which we will convert to a stream later on:
# GENERATE AND PLOT SAMPLE DATA
import matplotlib.pyplot as plt
import numpy as np

np.random.seed(10)
nb_points = 70

# Generate x values
x = np.linspace(0, nb_points - 1, nb_points).astype(int)

# Generate y values with a globally increasing trend and periodic pattern
trend = 0.3 * x**1.1  # Globally increasing trend
periodic_pattern = 10 * np.sin(2 * np.pi * x / 20)
noise = np.random.normal(0, 1, nb_points)

# Combine trend and periodic pattern to create y values
y = trend + periodic_pattern + noise


# PLOTTING
def set_params_plot():
    plt.xlabel("time")
    plt.ylabel("value")
    plt.xticks([], [])
    plt.yticks([], [])
    plt.title("")


# Plot the data points
plt.subplot(2, 1, 1)
set_params_plot()
plt.plot(x, y)

plt.show()

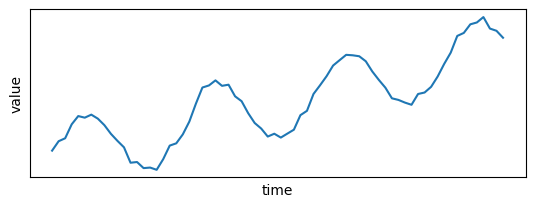
Great! The rule mentioned at the beginning should discover the peaks in this data. Let's see how to use Pathway to create an alerting application notifying us about these peaks.
We start by creating a stream out of the above data
import pathway as pw


value_functions = {
    "time": lambda i: int(x[i]),
    "value": lambda i: float(y[i]),
}


class InputSchema(pw.Schema):
    time: int
    value: float


input = pw.demo.generate_custom_stream(
    value_functions,
    schema=InputSchema,
    nb_rows=len(x),
    input_rate=50,
    autocommit_duration_ms=10,
)
To track the maximum value, we could write input.groupby().reduce(max=pw.reducers.max(input.value)). Here we want to keep track also when this maximum occurred, therefore we use the argmax_rows utility function.
reduced = pw.utils.filtering.argmax_rows(input, what=input.value)
The newly defined reduced table will contain only at most a single row, which will be automatically updated by Pathway with a current maximum. This is not yet what we want - adding alerting callback listening for changes to the above table, would result in excessive notifications.
We would want to keep a state with the previous maximum value and see if the change is significant, e.g. if a new maximum is 30% larger than the previous one. Such rule can be expressed as a plain Python function returning True if we want to accept new maximum and somehow save it in the state
def accept_larger_max(new_max: float, prev_max: float) -> bool:
    return (
        new_max > prev_max * 1.3
    )  # your custom business rule for deduplicating alerts
All you have to do now is to use the pw.stateful.deduplicate function to tell Pathway to use your newly defined rule. New values pushed by the stream to the col column will be compared to the previously accepted value using the acceptor function which we just wrote. Pathway will keep the needed state (i.e. previously accepted value) and perform all the necessary updates for you.
result = pw.stateful.deduplicate(reduced, col=reduced.value, acceptor=accept_larger_max)
Now we can send the alerts to e.g. Slack. We can do it similarly as in the realtime log monitoring tutorial by using pw.io.subscribe.
Here, for testing purposes, instead of sending an alert, we will store the accepted maxima in the list.
alerts = []


def send_alert(key, row, time, is_addition):
    if is_addition:
        alerts.append(
            row
        )  # change here to send slack message instead of appending to a list
pw.io.subscribe(result, send_alert)
Let's run the program. Since the stream we defined is bounded (and we set high input_rate in the generate_custom_stream), the call to pw.run will finish quickly. However, in most usecases, you will be streaming data (e.g. from kafka) indefinitely.
pw.run(monitoring_level=pw.MonitoringLevel.NONE)
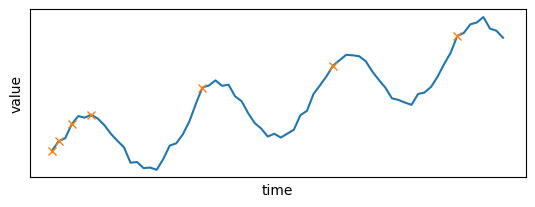
Let's see the results and plot them on the dataset, to see what the alerts are:
alerts
[{'time': 0, 'value': 1.331586504129518},
 {'time': 1, 'value': 4.1054489181478795},
 {'time': 3, 'value': 9.086296950451466},
 {'time': 6, 'value': 11.929292906576023},
 {'time': 23, 'value': 19.916221549411024},
 {'time': 43, 'value': 26.39125568534823},
 {'time': 62, 'value': 35.10960077729024}]
# plot alerted points on top of the data
plt.subplot(2, 1, 1)
set_params_plot()
plt.plot(x, y)
plt.plot([r["time"] for r in alerts], [r["value"] for r in alerts], "x")
plt.show()

Great, we won't be overwhelmed with excessive notifications! One downside is that initially we get some alerts, but this is how we defined our deduplication rule! It is easy to fix it by e.g. by considering maxima above a given threshold.
The presented deduplication functionality can be used in many other contexts - e.g. in transportation to filter GPS positions of devices so that we keep only relevant measurements which are sufficiently distant apart.
 Saksham Goel
 blog · tutorial · engineeringFeb 5, 2025Real-Time AI Pipeline with DeepSeek, Ollama and Pathway
 Saksham Goel
 tutorial · engineeringMay 30, 2025Real-Time Multimodal Data Processing with Pathway and Docling
 Data Engineering Weekly
 tutorial · engineeringMar 9, 2023Unlocking data stream processing [Part 2] - realtime server logs monitoring with a sliding window

