Exploring Kappa Architecture with Pathway

 Shlok Srivastava
Modern data processing has come a long way from traditional ETL (Extract, Transform, Load) pipelines that work on fixed, structured datasets at daily or hourly intervals. Over the last decade, the volume and velocity of data have exploded, driven by digital transformation and the proliferation of sensors, mobile devices, and distributed systems. As data requirements shifted from purely batch-oriented to near real-time or real-time analytics, new architectural paradigms emerged to handle continuous data streams at a massive scale.
Real-Time Analytics: Challenges and Requirements
Real-time analytics is about processing, analyzing, and drawing insights from data almost as soon as it arrives. Key challenges include:
- High Throughput and Low Latency: Systems must ingest tens of thousands to millions of events per second with minimal end-to-end latency.
- Fault Tolerance and Reliability: Crashes, network issues, and data inconsistencies must be gracefully handled.
- Scalability: The architecture should scale horizontally as data volumes grow.
- Unified Processing Model: As organizations move toward continuous intelligence, they seek architectures that can consistently handle real-time streams and historical reprocessing.
Before diving into Kappa architecture, some key concepts that are required to better understand this architecture are discussed below.
Key Concepts: Stream Processing vs. Batch Processing
Understanding these two key concepts are crucial for the understanding of this article. For the sake of not deviating a lot from the topic at hand, both these concepts are covered briefly below. You can read more about these systems and learn the differences in this article
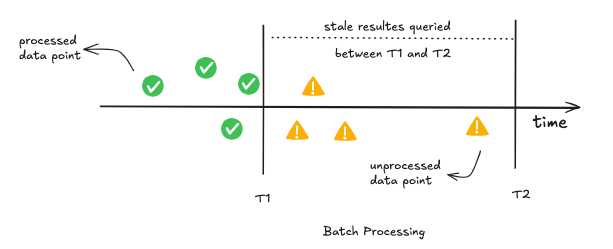
Batch Processing
It involves processing large datasets in discrete chunks, typically on a schedule. Common technologies include Apache Hadoop, Apache Spark and the Pathway Live Data Framework.
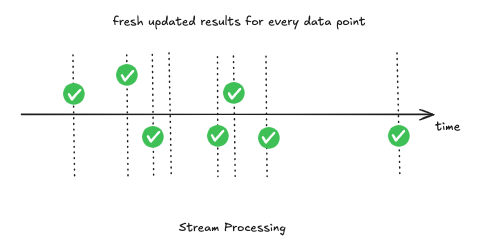
Stream Processing
Operates on continuous data flows, event by event (or in small micro-batches). Technologies like Apache Kafka, Apache Flink, Spark Streaming, and the Pathway Live Data Framework provide this capability.
Both paradigms have their strengths—batch processing excels at handling massive amounts of historical data efficiently, while stream processing enables near real-time insights. However, as organizations increasingly seek continuous intelligence (combining timely analysis with historical context), the need arose for architectural approaches that could integrate the best of both worlds. This led to the Lambda Architecture.
A Technical Overview of Lambda Architecture
Lambda Architecture addresses the combined needs of large-scale batch processing and real-time data analysis by dividing the workflow into three distinct layers. Each layer focuses on a specific role in the data pipeline:
The Three Layers (Batch Layer, Speed/Stream Layer, Serving Layer)
1. Batch Layer
The batch layer does the following operations:
- Acts as master Dataset & Storage
- Stores all incoming data—often in immutable, append-only form—in a large-scale data lake such as HDFS or Amazon S3.
- The raw data is typically partitioned by date/time or another logical dimension to facilitate parallel processing.
- Does Batch Processing
- Executes data transformations using distributed processing frameworks like Apache Spark or Hadoop MapReduce.
- Handles very large volumes of data in a fault-tolerant manner, leveraging cluster-computing paradigms (e.g., YARN, Kubernetes) for resource management.
- Provides Periodic Batch Views
- At scheduled intervals (hourly, daily, etc.), the batch layer generates “batch views”—comprehensive, aggregated datasets or materialized tables that represent the most accurate, historical snapshot of the system.
- These batch views can be stored in scalable NoSQL stores (HBase, Cassandra) or published to analytical platforms (Hive tables, Spark tables, etc.) for downstream consumption.
- Typically, the batch layer can backfill or reprocess historical data if new logic is introduced or errors are discovered.
2. Speed/Stream Layer
The Stream layer is responsible for the following operations:
- Real-Time Ingestion
- Ingests streaming data from message buses or distributed logs (e.g., Apache Kafka, Redpanda, or Pulsar) in near real-time.
- Each new data event (e.g., clickstream record, sensor reading) is processed immediately or within micro-batches (seconds to milliseconds).
- Streaming Frameworks
- Utilizes stream processing engines such as Spark Streaming, Apache Flink, Kafka Streams, or the Pathway Live Data Framework, which is a Python-based real-time framework that can seamlessly handle both streaming and static datasets.
- Implements functions like windowed aggregations, filtering, or real-time joins.
- Often runs on containerized or distributed environments (e.g., Kubernetes) for scalable, fault-tolerant execution.
- Real-time/Speed Views
- Outputs continuous, incremental updates—called “speed views”—that reflect recent events.
- Speed views are typically stored in high-performance data stores (like Redis, Cassandra, or in-memory tables) for quick reads.
- These views are optimized for low-latency queries but may not contain the fully cleansed, historical perspective that the batch layer provides.
3. Serving Layer
The serving layer does the following operations:
- Data Merging & Harmonization
- Merges or reconciles the long-running batch views (comprehensive but updated less frequently) with the speed views (highly fresh but potentially incomplete or approximate).
- This can involve a “lambda merge” step where a downstream query engine or microservice combines historical aggregates with recent streaming data.
- Unified Output & Queries
- Presents a consistent API or data endpoint—often via REST, GraphQL, or direct SQL queries to a serving database.
- Enables end-users, BI tools, or analytic applications to see near real-time insights without waiting for the next batch job to finish.
- Storage & Access Patterns
- Typically stores merged data in a read-optimized database (e.g., Cassandra, HBase, Elasticsearch) or uses a caching layer for sub-second response times.
- May include features like secondary indexes or search capabilities for flexible querying.
- Ensures that newly arrived data is quickly queryable while still eventually reflecting the fully processed batch data.
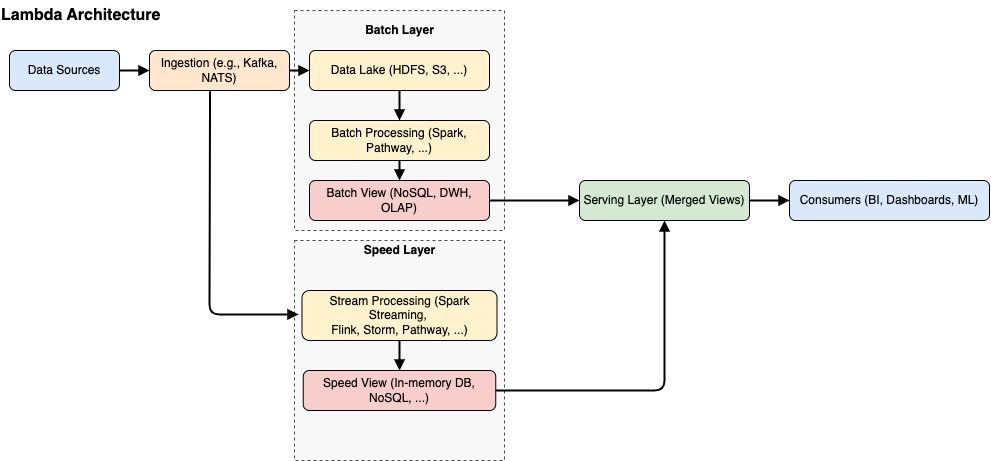
Common Software Stack used in Lambda Architecture
Below are some of the common software stacks used in different layers of the lambda architecture.
Batch Layer
- Data Lakes:
- HDFS (on-prem) or Amazon S3, Azure Data Lake, Google Cloud Storage (cloud-based) for storing large-scale, immutable datasets. Partitioned and possibly compressed to optimize parallel reading and processing.
- Batch Processing Frameworks:
- Hadoop MapReduce: A foundational, fault-tolerant batch processing system.
- Apache Spark (batch mode): Offers faster, in-memory batch processing compared to traditional MapReduce.
- Hive (on top of Hadoop): Provides a SQL-like interface for batch queries.
Speed Layer
- Messaging & Event Ingestion:
- Apache Kafka: The most common messaging backbone for real-time pipelines, enabling high-throughput, fault-tolerant ingestion.
- Redpanda, Pulsar, NATS or other distributed log technologies serve similar roles.
- Stream Processing Engines:
- Apache Spark Streaming, Apache Flink, Apache Storm, or Kafka Streams: Continuously process new data events in real time or near real time.
- Pathway Live Data Framework: A Python-based real-time framework that unifies both streaming and static data processing, simplifying the need for separate codebases.
Serving Layer
- Databases & Indexes:
- NoSQL Stores like Cassandra or HBase for high-write, low-latency workloads.
- Elasticsearch for full-text search and real-time analytics queries.
- Relational Databases (e.g., PostgreSQL) may also be used if transactional guarantees are needed at the serving stage.
- Caching & Aggregation:
- Redis, Memcached, or in-memory tables for sub-second query responses.
- Advanced caching layers can merge or reconcile batch (historical) and speed (real-time) data for unified output.
Pros & Cons
While Lambda Architecture brings clear advantages, it also introduces additional complexity.
1. Pros
- Robustness: The batch layer ensures data correctness, even if the speed layer temporarily misses or processes some events.
- Scalability: Each layer (batch, speed, serving) can scale independently, allowing organizations to fine-tune resource allocation.
- Fault Tolerance: Batch processing frameworks (Hadoop, Spark) are designed for automatic retries and can reprocess historical data.
2. Cons
- Dual Codebase: Data processing logic must often be implemented twice—once for the batch layer and once for the speed layer—which can lead to technical debt and potential inconsistencies.
- Operational Complexity: Managing and coordinating multiple systems (e.g., Kafka + Spark + NoSQL + caching) requires significant DevOps overhead.
- Latency vs. Complexity Trade-off: Maintaining real-time accuracy can be challenging due to the separate batch and speed views that need eventual consistency.
Despite Lambda Architecture’s strengths, some teams seek a simpler, single-pipeline alternative that can handle both real-time data and historical reprocessing without managing two separate layers. This desire to reduce operational overhead and unify data processing flows led to the development of Kappa Architecture.
Introduction to Kappa Architecture
Kappa Architecture was proposed by Jay Kreps, one of the co-creators of Apache Kafka, as a more streamlined alternative to Lambda Architecture. Its guiding principle is that both real-time and historical data processing can be achieved through a single pipeline rather than splitting the pipeline into separate batch and speed layers. By relying on a log-centric design (such as Kafka), Kappa Architecture simplifies operations, reduces duplicated logic, and allows for easier maintenance and reprocessing. All these characteristics of Kappa Architecture are discussed in detail next.
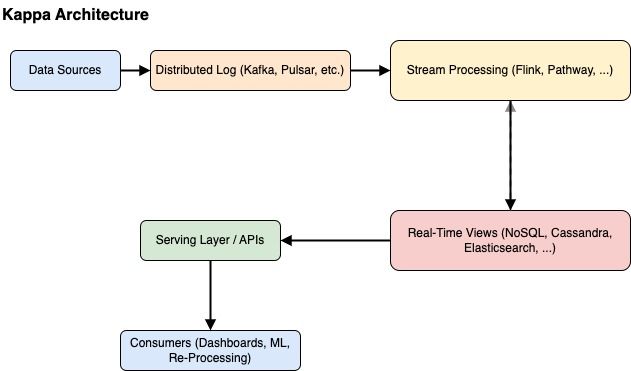
A Single Processing Pipeline
Rather than maintaining dual codebases—one for large-scale batch analytics and one for low-latency stream processing—Kappa Architecture unifies everything under a single, continuous data-processing system. All transformations, aggregations, or machine learning inferences happen in one place, relying on a stream-processing framework that can handle both live data and historical data. This approach addresses one of the main complexities of Lambda Architecture, where developers often struggle to keep two parallel data flows (batch vs. speed) synchronized and consistent.
The Immutable, Append-Only Log
At the heart of Kappa Architecture lies the idea of an immutable, append-only log. Every piece of data—be it a user event, a sensor reading, or a transaction—gets recorded in this distributed log (e.g., Apache Kafka). The log then becomes the system of record, meaning it contains the entire history of all events in the order they occurred. Downstream consumers (stream processors or analytics engines) simply read the log to perform real-time computations. Because the log is append-only, data never disappears prematurely; instead, it remains accessible for historical or replay operations, subject to retention policies.
Stream Reprocessing for Historical Data
One of the hallmark features of Kappa Architecture is its ability to reprocess historical data without needing a separate batch layer. If you update your business logic—say, to fix a bug or incorporate new rules—you can simply direct your streaming application to replay events from the earliest offset of the log. This replay effectively mimics batch processing on the entire dataset, but without introducing a second pipeline or codebase. The same functions that handle new events can also reprocess old ones. Snapshot/persistence can make this faster by not starting from scratch every time. In doing so, Kappa Architecture marries real-time responsiveness with the ability to recast historical data under evolving analytics logic, all within a single unified system.
By consolidating data pipelines in this way, Kappa Architecture minimizes operational overhead and avoids the “dual codebase” drawback of Lambda. Developers implement their transformations once, and the log-based infrastructure, combined with a robust stream-processing framework, ensures those transformations can be applied in both real-time ingestion and historical replay scenarios.
Key Technologies and Frameworks Used in Kappa Architecture
One of the core ideas behind Kappa Architecture is that all data processing—both real-time and historical—passes through a single pipeline, built around an append-only log. To make this vision a reality, most implementations rely on a combination of robust messaging systems, powerful stream processors, and storage solutions that support both real-time and long-term analytical queries. Below are some of the key technologies and frameworks used to implement Kappa Architecture categorized under each layer of the architecture:
Messaging Layer
At the foundation of Kappa Architecture lies a distributed, partitioned log, typically implemented via Apache Kafka, Redpanda, NATS, or Pulsar. These systems provide a fault-tolerant and scalable way to ingest events at high throughput and persist them in an immutable sequence. By treating data as a sequential log of records, the messaging layer not only handles real-time flow but also retains historical data for reprocessing. Each topic (or partition) represents a logical channel for the event and consumers—such as stream processors—read from these topics at their own pace. This design decouples producers (data sources) from consumers (processing engines), enabling horizontal scaling and replay functionality.
Stream Processors
The stream processing engine is the heart of Kappa Architecture, responsible for reading the append-only log and performing the necessary transformations, aggregations, or enrichments on incoming data. Multiple technologies exist, each with its strengths:
- Apache Spark
Initially developed for large-scale batch analytics, Apache Spark has evolved to handle real-time workloads through Structured Streaming. It uses a micro-batch approach to process streaming data in near real-time while leveraging Spark’s RDD and DataFrame APIs. Spark integrates seamlessly with a variety of data sources (e.g., Apache Kafka, Amazon Kinesis, file systems) and provides a robust ecosystem for advanced analytics and machine learning. Its checkpointing and fault-tolerance mechanisms make Spark well-suited for streaming scenarios, all while retaining the benefit of a unified engine for both batch and streaming processing. - Apache Flink
Renowned for its advanced features such as event-time processing and fine-grained state management, Flink excels in scenarios requiring low-latency stream processing and exactly-once guarantees. It supports a wide variety of connectors and has a rich ecosystem for complex event processing, including machine learning libraries and CEP (Complex Event Processing) components. - Pathway Live Data Framework
A Python-based real-time processing framework designed to simplify the development of streaming applications. The Pathway Live Data Framework offers a declarative API that treats data transformations as high-level instructions, making it easier for teams with Python expertise to implement complex logic without wrestling with low-level streaming concepts. Crucially, the Pathway Live Data Framework unifies both streaming and static data ingestion, which aligns well with Kappa’s principle of handling historical replays using the same codebase. This allows developers to avoid writing a separate batch pipeline when backfilling data or changing business logic.
Regardless of which engine is selected, stream processors in a Kappa Architecture typically maintain local or external state (e.g., keyed windows, session state, or aggregation tables) to produce continuous, updated views of the data in near real-time.
Storage Solutions
Finally, data storage in a Kappa Architecture caters to two primary needs: maintaining fast, real-time views for operational dashboards or user queries, and storing more extensive datasets for deeper analysis or regulatory compliance. Common choices vary based on performance and query patterns:
- Elasticsearch is often used where text search or advanced analytical queries over semi-structured data are required. Its near real-time indexing capabilities make it suitable for continuously updated data streams.
- Cassandra and HBase excel in high-write, low-latency use cases, commonly acting as backing stores for materialized views or time-series data.
- PostgreSQL (and other relational databases) may be used when transactions, ad-hoc queries, or stronger consistency guarantees are needed, though they typically require sharding strategies to match the scale of a large stream.
- In-memory stores such as Redis are used where sub-millisecond access is crucial, for example in leaderboard computations or real-time counters.
- Stream processor state backends (e.g., Flink’s state backend, Kafka Streams’ state stores, or the Pathway Live Data Framework’s built-in state management) can also be used to manage aggregations or joins without relying on an external database.
By combining a robust messaging layer, a flexible stream processing engine (e.g., Kafka Streams, Flink, Pathway), and an appropriate storage solution, Kappa Architecture achieves both low-latency insights and the ability to replay historical data for iterative analytics—without the complexity of maintaining separate batch and speed layers.
Comparing Lambda and Kappa:
Key differences
| Aspect | Lambda Architecture | Kappa Architecture |
| Data Flow | Two separate paths: Batch + Speed | One unified stream pipeline |
| Code Duplication | Requires separate logic for batch & speed | Single codebase for all processing |
| Reprocessing | Handled by re-running batch jobs. That processes all data in a batch again. | Reprocessing is handled by replaying the log from any point in time through the same streaming app. |
| Complexity | Higher operational and development complexity | Lower operational overhead, simpler to maintain |
Performance, Scalability, and Latency Considerations
- Lambda
Batch layers can handle huge volumes but have higher latency to produce final views. Speed layers provide partial or approximate real-time data. - Kappa
The results are always consistent with the data received, in real-time. Unlike Lambda where the batch layer is inconsistent between two runs.
Operational Costs and Maintenance
- Lambda
More complex DevOps processes since you’re managing two distinct pipelines (batch + speed) and ensuring data correctness between them. - Kappa
Simplified DevOps, but the messaging backbone (Kafka) and the streaming engine must be well-monitored to handle spikes and potential replay operations.
Specific Use Case Scenarios
No single architecture solves every data challenge. The choice between Lambda and Kappa often depends on an organization’s existing infrastructure, data requirements, and long-term goals. Here are some scenarios that typically favor one approach over the other:
Lambda Architecture
- Large, Historical Datasets: Well-suited for massive offline analytics, such as daily transformations or periodic reprocessing of heavy, historical data.
- Existing Batch Infrastructure: Ideal if significant investments have already been made in Hadoop, Spark, or other batch-oriented systems.
Kappa Architecture
- Real-Time Analytics with Frequent Replays: Designed for pipelines that must quickly adapt to changing business logic, requiring on-demand reprocessing without a separate batch layer.
- Event-Driven Environments: A strong fit for distributed-log ecosystems (e.g., Kafka, Pulsar) where all data flows through a single, immutable log, enabling consistent handling of both current and historical events.
Having compared Lambda and Kappa in detail, and explored how Kappa unifies real-time and historical processing under a single log-based pipeline, it’s time to turn towards practical implementation. The next section demonstrates how to build a Kappa-style data pipeline using Apache Kafka as the distributed log and the Pathway Live Data Framework as the real-time streaming engine. By following these steps, you’ll see how Kappa’s principles—single codebase, immutable log, and reprocessing via replay—translate into a tangible system architecture.
Implementing Kappa Architecture on a Stream of Logs
Imagine you’re responsible for an e-commerce platform that handles thousands of log entries every second—covering everything from user interactions to system health checks. The logs are continuously pushed into Kafka, allowing various teams to consume and analyze the data in real-time. However, your main concern is error monitoring. You want to:
- Identify error logs
(level == "ERROR")as soon as they appear. - Track how many errors occur each minute, so you can spot unusual spikes that might signal a production issue or system outage.
Instead of running periodic batch jobs that pick up error counts long after they’ve occurred, you prefer a real-time approach that highlights issues within seconds. This will help your on-call team respond to problems faster, ultimately reducing downtime and improving the overall reliability of your platform.
You end up with the below architecture as your solution to the above problem statement. Here Kafka is used for streaming real-time data, the Pathway Live Data Framework acts as the core of your Kappa architecture to compute error count over a sliding window and finally, PostgreSQL as your long term storage.
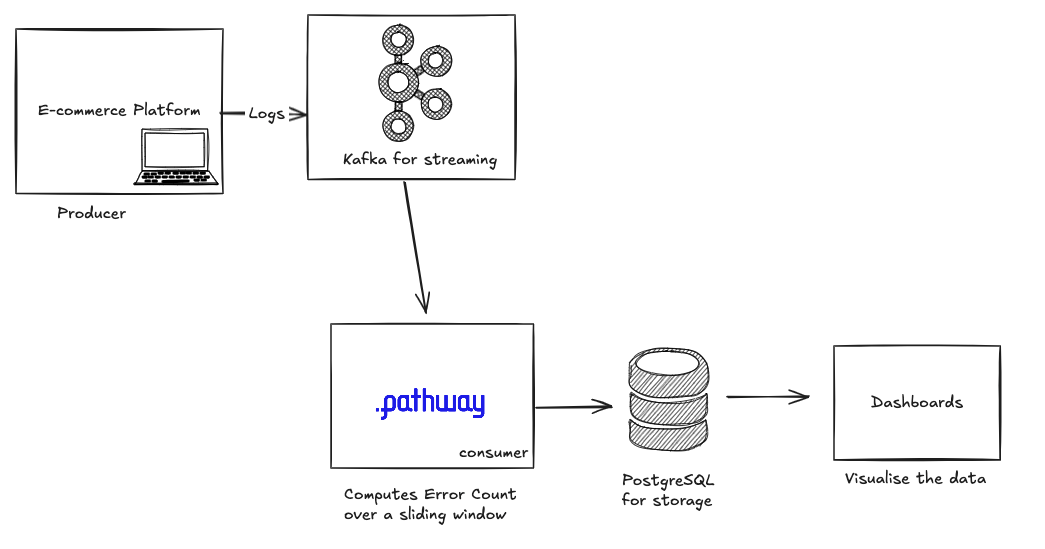
The Pathway Live Data Framework is an excellent candidate to help with the solution for this problem. In the following solution, the Pathway Live Data Framework will be used to:
- Ingest logs directly from a Kafka topic.
- Filter out only those entries that are labeled as “ERROR.”
- Aggregate the resulting errors in a 60-second sliding window, updated every 10 seconds, to generate a near real-time error count.
- Write these counts into PostgreSQL for long-term storage and dashboard visualization.
By the end, you’ll have a lightweight streaming pipeline that provides continuous visibility into your system’s health, letting you take proactive steps whenever errors start to spike.
You can read more about the Pathway architecture here:
Building the Pipeline (Step-by-Step)
Prerequisites and Setup
Before starting with the solution, ensure that you have the following prerequisites installed:
Installing Kafka
Here, Docker and docker-compose are used to install and run Kafka. If you prefer a different method (e.g., installing Kafka directly or using another container solution), feel free to adapt accordingly.
Step 1: Create a Docker Compose File
- Open your terminal (or command prompt).
- Navigate to an empty directory where you want to keep your Docker-related files (e.g.,
cd ~/kappa-demo). - Create a file named
docker-compose.ymlwith the following contents. You can use a text editor (likenano,vim, orVS Code), or echo the snippet directly in your terminal:
version: '3'
services:
  zookeeper:
    image: bitnami/zookeeper:latest
    container_name: zookeeper
    environment:
      - ALLOW_ANONYMOUS_LOGIN=yes    # Allow unauthenticated connections
      - ZOO_SERVER_ID=1
      - ZOO_SERVERS=0.0.0.0:2888:3888
    ports:
      - "2181:2181"
  kafka:
    image: bitnami/kafka:latest
    container_name: kafka
    depends_on:
      - zookeeper
    environment:
      - KAFKA_BROKER_ID=1
      - KAFKA_ZOOKEEPER_CONNECT=zookeeper:2181  # Use the correct variable name
      - ALLOW_PLAINTEXT_LISTENER=yes
      - KAFKA_CFG_LISTENERS=PLAINTEXT://0.0.0.0:9092
      - KAFKA_CFG_ADVERTISED_LISTENERS=PLAINTEXT://localhost:9092
    ports:
      - "9092:9092"
Explanation: This Docker Compose file defines two services:
- Zookeeper: Handles service discovery and configuration for Kafka.
- Kafka: The actual distributed log broker. Exposes port 9092 for client connections.
Step 2: Run Docker Compose
Still in your terminal, launch the containers:
docker-compose up -d
Check the logs to see if Kafka and Zookeeper started correctly by running the following command:
docker-compose logs kafka | grep "started"
You should see log entries indicating the broker has started successfully. You can list the running containers by using the following command:
docker ps
You should see two containers: one for Zookeeper and one for Kafka.
With this setup, Kafka is accessible at localhost:9092, and Zookeeper is at localhost:2181—though, for many Kafka clients, you only need the Kafka address.
With Zookeeper and Kafka running, you’re ready to publish and consume messages in your Kappa pipeline! Now let’s ensure that you have a postgreSQL server running.
Installing PostgreSQL
Step 1: Pull the PostgreSQL Image
Open your terminal and pull the official Postgres image:
docker pull postgres:latest
This ensures you have the most recent version of PostgreSQL available locally.
Step 2: Run the Postgres Container
Still in your terminal, start a Postgres container with a simple command:
docker run --name my-postgres \
  -e POSTGRES_PASSWORD=secret \
  -p 5432:5432 \
  -d postgres:latest
Here’s what each part of the command does:
--name my-postgresAssigns a human-readable name to the container, making it easier to reference later.-e POSTGRES_PASSWORD=secretSets the environment variable for the superuser password to secret (choose a different password in production).-p 5432:5432Exposes Postgres on port 5432, both inside the container and on your local machine.-d postgres:latestRuns the container in detached mode and uses thepostgres:latestimage.
Check if the container is running and logs are showing Postgres is ready by listing the running containers again:
docker ps
You should see my-postgres in the list of active containers. Check for logs of this container to ensure that the server is up, use the following command:
docker logs my-postgres
Look for messages such as:
PostgreSQL init process complete; ready for start up.
LOG:  database system is ready to accept connections
This confirms Postgres is up and running.
Step 4: Connecting to PostgreSQL
By default, Postgres is available at localhost:5432, with a superuser named postgres and a secret password of secret. To connect:
- Install the psql CLI locally (if not already installed).
- Run the following command:
psql -h localhost -U postgres
- When prompted, enter the password
secret(or whatever you specified in thedocker runcommand).
You’ll now be inside the psql interactive shell, where you can create databases, tables, etc. For example:
CREATE DATABASE kappa_pipeline;
\c kappa_pipeline
With Postgres running, you’re set to persist data and perform long-term analytics—an important piece of your Kappa Pipeline that avoids the need for a separate batch system.
Installing Pathway and Dependencies
Ensure you have Python 3.8+. Then install the required packages by running the following command:
pip install pathway kafka-python psycopg2
- pathway: The Pathway Live Data Framework real-time stream processing package
- kafka-python: For producing/consuming Kafka messages in Python
- psycopg2: For connecting to PostgreSQL from Python
(Adjust if you prefer a virtual environment, e.g., python -m venv venv then source venv/bin/activate.)
You need to simulate the incoming data somehow, write a demo producer that produces random logs and sends it to a kafka topic. This simulates the problem statement for us. Below are the steps to write this producer:
Producer: Send Logs to Kafka
Follow the below steps to write your producer script:
Step 1: Create a File Named producer.py
Open your favorite text editor in the same project directory where you set up Kafka/Postgres/Pathway, and paste the following code:
import time
import random
import json
import datetime
from kafka import KafkaProducer

# Change these to match your Kafka configuration
KAFKA_BOOTSTRAP_SERVERS = "localhost:9092"
TOPIC_NAME = "app-logs"

def main():
    # Create a Kafka producer that sends JSON-encoded messages
    producer = KafkaProducer(
        bootstrap_servers=KAFKA_BOOTSTRAP_SERVERS,
        value_serializer=lambda v: json.dumps(v).encode("utf-8")
    )

    log_levels = ["INFO", "WARN", "ERROR"]
    messages_to_send = 20  # Number of log messages to publish

    print(f"Producing log messages to topic '{TOPIC_NAME}'...")
    for i in range(messages_to_send):
        # Simulate a realistic log event
        log_event = {
            "timestamp": datetime.datetime.utcnow().isoformat(),
            "level": random.choice(log_levels),
            "message": f"Application event #{i}",
            "service": f"service_{random.randint(1, 5)}",  # Could represent different microservices
        }
        producer.send(TOPIC_NAME, log_event)
        print(f"Sent: {log_event}")
        time.sleep(random.uniform(0.3, 1.0))  # simulate varying log frequency

    producer.close()
    print("Finished sending log messages.")

if __name__ == "__main__":
    main()
What This Script Does
- Kafka Producer: Instantiates a Kafka producer connected to localhost:9092 (adjust if running elsewhere).
- Realistic Log Messages: Generates log entries that might appear in a production environment, including a timestamp, a log level, a textual message, and a service identifier (e.g., service_3).
- Random Timing: Adds a small random delay between messages to mimic real-world asynchronous log generation.
Step 2: Run the Producer Script
From your terminal (in the same directory as producer.py):
python producer.py
If successful, you’ll see output like:
Producing log messages to topic 'app-logs'...
Sent: {'timestamp': '2025-01-22T12:00:00.123456Z', 'level': 'INFO', 'message': 'Application event #0', 'service': 'service_4'}
Sent: {'timestamp': '2025-01-22T12:00:01.654321Z', 'level': 'ERROR', 'message': 'Application event #1', 'service': 'service_2'}
...
Finished sending log messages.
Verification
- The messages are now stored in Kafka under the
app-logstopic. - In the next step, you’ll create a Pathway consumer to read these messages, filter them, and aggregate any errors before storing them in PostgreSQL.
With the producer running smoothly, you’ve set the stage for real-time data ingestion—the core of your Kappa pipeline.
Consumer: Pathway for Real-Time Ingestion and Aggregation
After setting up Kafka (for publishing logs) and PostgreSQL (for storing processed results), the Pathway Live Data Framework will serve as the stream-processing engine in our Kappa-style pipeline. In this section, bring everything together by creating a Python script that:
- Ingests log messages from the
app-logsKafka topic. - Parses each JSON record into a structured form.
- Filters logs that are labeled
ERROR(our primary concern for real-time alerting and troubleshooting). - Aggregates these errors in a rolling time window, providing near real-time metrics on error frequency.Persists the final, aggregated counts in a PostgreSQL table for long-term analytics and dashboards.
This unified flow demonstrates Kappa Architecture in action. Instead of splitting data into separate “batch” and “speed” pipelines, you maintain one log-based pipeline—capable of replaying historical events on demand—while still delivering continuous, low-latency insights to your operations team.
Follow the below steps to write this consumer:
Step 1: Create main.py
Open a text editor in your project directory and paste the following code into a new file named main.py:
import pathway as pw
from datetime import timedelta
# Define Kafka connection settings.
rdkafka_settings = {
    "bootstrap.servers": "localhost:9092",
    "group.id": "kappa-logs-consumer"
}

# Define the schema for your log messages.
# Note: The timestamp is initially a string.
class LogSchema(pw.Schema):
    timestamp: str
    level: str
    message: str
    service: str

# 1) Read logs from Kafka.
logs_stream = pw.io.kafka.read(
    rdkafka_settings,
    topic="app-logs",
    format="json",
    schema=LogSchema
)

# 2) Filter for ERROR logs.
error_logs = logs_stream.filter(logs_stream.level == "ERROR")

# 3) Convert the timestamp from string to datetime.
#    Use a format that includes fractional seconds.
converted_logs = error_logs.select(
    timestamp = pw.this.timestamp.dt.strptime("%Y-%m-%dT%H:%M:%S.%f"),
    level     = pw.this.level,
    message   = pw.this.message,
    service   = pw.this.service
)

# 4) Aggregate error logs using a sliding window:
#    - Duration: 60 seconds, Hop: 10 seconds.
error_count_by_minute = converted_logs.windowby(
    converted_logs.timestamp,
    window=pw.temporal.sliding(
        duration=timedelta(seconds=60),
        hop=timedelta(seconds=10)
    )
).reduce(
    count_errors = pw.reducers.count()
)

# 5) Define Postgres connection settings.
postgres_settings = {
    "host": "localhost",
    "port": "5432",
    "dbname": "postgres",    # Using your database name.
    "user": "postgres",      # Using your username.
    "password": "secret"     # Using your password.
}

# 6) Write the aggregated error counts to Postgres.
#    This writes to a table named "error_counts". Using init_mode="create_if_not_exists"
#    will create the table automatically if it does not already exist.
pw.io.postgres.write(
    error_count_by_minute,
    postgres_settings,
    "error_counts",
    init_mode="create_if_not_exists"
)

# (Optional) Print results to the console for debugging.
#pw.debug.compute_and_print(error_count_by_minute, include_id=False)
# Start the streaming execution.

pw.run()
Code Explanation
- Kafka Ingestion
pw.io.kafka.read(...)sets up a continuous stream that reads from theapp-logstopic, ensuring every new message is available for processing.
- Transformation
- The
converted_logstable stores each raw dictionary (row) into a normalized format, extracting fields liketimestamp,level, andservice.
- The
- Filtering
- Logs with
logs_stream.level == "ERROR"pass through; others are discarded, minimizing noise in the error-focused pipeline.
- Logs with
- Windowed Aggregation
converted_logs.windowby(size=60, slide=10)defines a 60-second rolling window, recalculated every 10 seconds. This yields near real-time counts of how many errors occurred in the past minute.
- PostgreSQL Output
- The final aggregates are written to a table named
error_countsin Postgres, allowing for long-term storage, dashboards, or additional SQL-based analytics.
- The final aggregates are written to a table named
Step 2: Run the Pathway Live Data Framework Consumer
With all prerequisites in place (Kafka, Postgres, and the Pathway Live Data Framework installed), launch this consumer:
python main.py
You should see console output that updates every 10 seconds, reflecting how many ERROR logs were detected in the preceding 60-second window. Meanwhile, the Pathway Live Data Framework automatically inserts these same counts into your PostgreSQL database.
Step 3: Query Your Results
- Connect to Postgres via
psqlor a GUI tool (e.g., pgAdmin). - Verify the aggregated counts with a simple query:
SELECT * FROM error_counts;
Expect to see one or more columns that detail each sliding window interval along with the total number of errors in that interval.
By completing this step, you’ve built a production-like streaming data flow—capable of generating, filtering, transforming, and archiving logs with minimal overhead and maximum flexibility.
Real-Time Visualization (Dashboards, Alerting Systems)
Now that the real-time pipeline is ready, the solution can be further enhanced by automating and visualizing the results.
Tools like Grafana or Kibana can poll your chosen data store to generate real-time charts and metrics. If the error rate crosses a certain threshold, you can trigger automated alerts via PagerDuty, Slack, or other incident management platforms.
This single-pipeline approach is at the core of Kappa Architecture, eliminating the need for a separate batch system when reprocessing historical data. Two key features enable this:
- Checkpoints and Snapshots \ The Pathway Live Data Framework periodically records the current processing state, allowing quick restarts or rollbacks if a failure occurs. Since the state is preserved, the stream can resume from where it left off without losing or duplicating data.
- Replay from Earliest Offsets \ When logic changes or errors occur, simply reset the consumer offsets in Kafka to the earliest available point. The pipeline then re-ingests all past events and applies the same transformations—mirroring batch processing without requiring a separate batch codebase. This ensures both real-time responsiveness and the ability to correct historical outputs within a single, unified framework.
6. Best Practices for Technical Success with Kappa
Below are some of the best practices to use while implementing Kappa Architecture:
- Decouple Data Format
Use Avro or Protobuf with a schema registry to ensure seamless field additions or modifications. - Backward/Forward Compatibility
Design messages so that older consumers can read new fields without breaking. - Partitioning Strategies
Partition by a key that supports your aggregation or join needs (e.g.,userId,deviceId). - Exactly-Once Semantics
The Pathway Live Data Framework, Flink, and Kafka Streams offer strong guarantees to minimize duplicate events. - Metrics
Track throughput, event lag, and average processing latency. - Logging & Tracing
Use distributed tracing (e.g., OpenTelemetry) for complex, multi-service pipelines and****integrate with Prometheus or Grafana for real-time dashboarding. - Data Encryption
Enable TLS for communication between Kafka brokers, the Pathway Live Data Framework, and other microservices. - Access Control
Use Kafka ACLs or RBAC to restrict read/write privileges. - Regulatory Compliance
Ensure you can remove or anonymize data to meet GDPR/CCPA “right to be forgotten” requirements.
Conclusion
Overall, the concepts illustrated here form a strong foundation for building and scaling real-time data systems. By leveraging Kappa Architecture and frameworks like the Pathway Live Data Framework, organizations can optimize data pipelines, accelerate time-to-insight, and maintain a unified processing model for historical and streaming data alike.


