Real-Time Twitter Sentiment Analysis and Prediction App with Pathway
 Mateusz Lewandowski
Real-Time Twitter Sentiment Analysis and Prediction App with Pathway
Have you ever thought of analyzing public sentiment by looking at tweets? It is rather cool to see how information spreads in a social network and across the globe. After all, information shapes the world - brands care about it, politicians care about it, we at Pathway also care about it.
Today we are going to show you how to build a Twitter streaming app for sentiment analysis in 15 minutes. Sit tight and catch a manul to warm up!
What are we going to build?
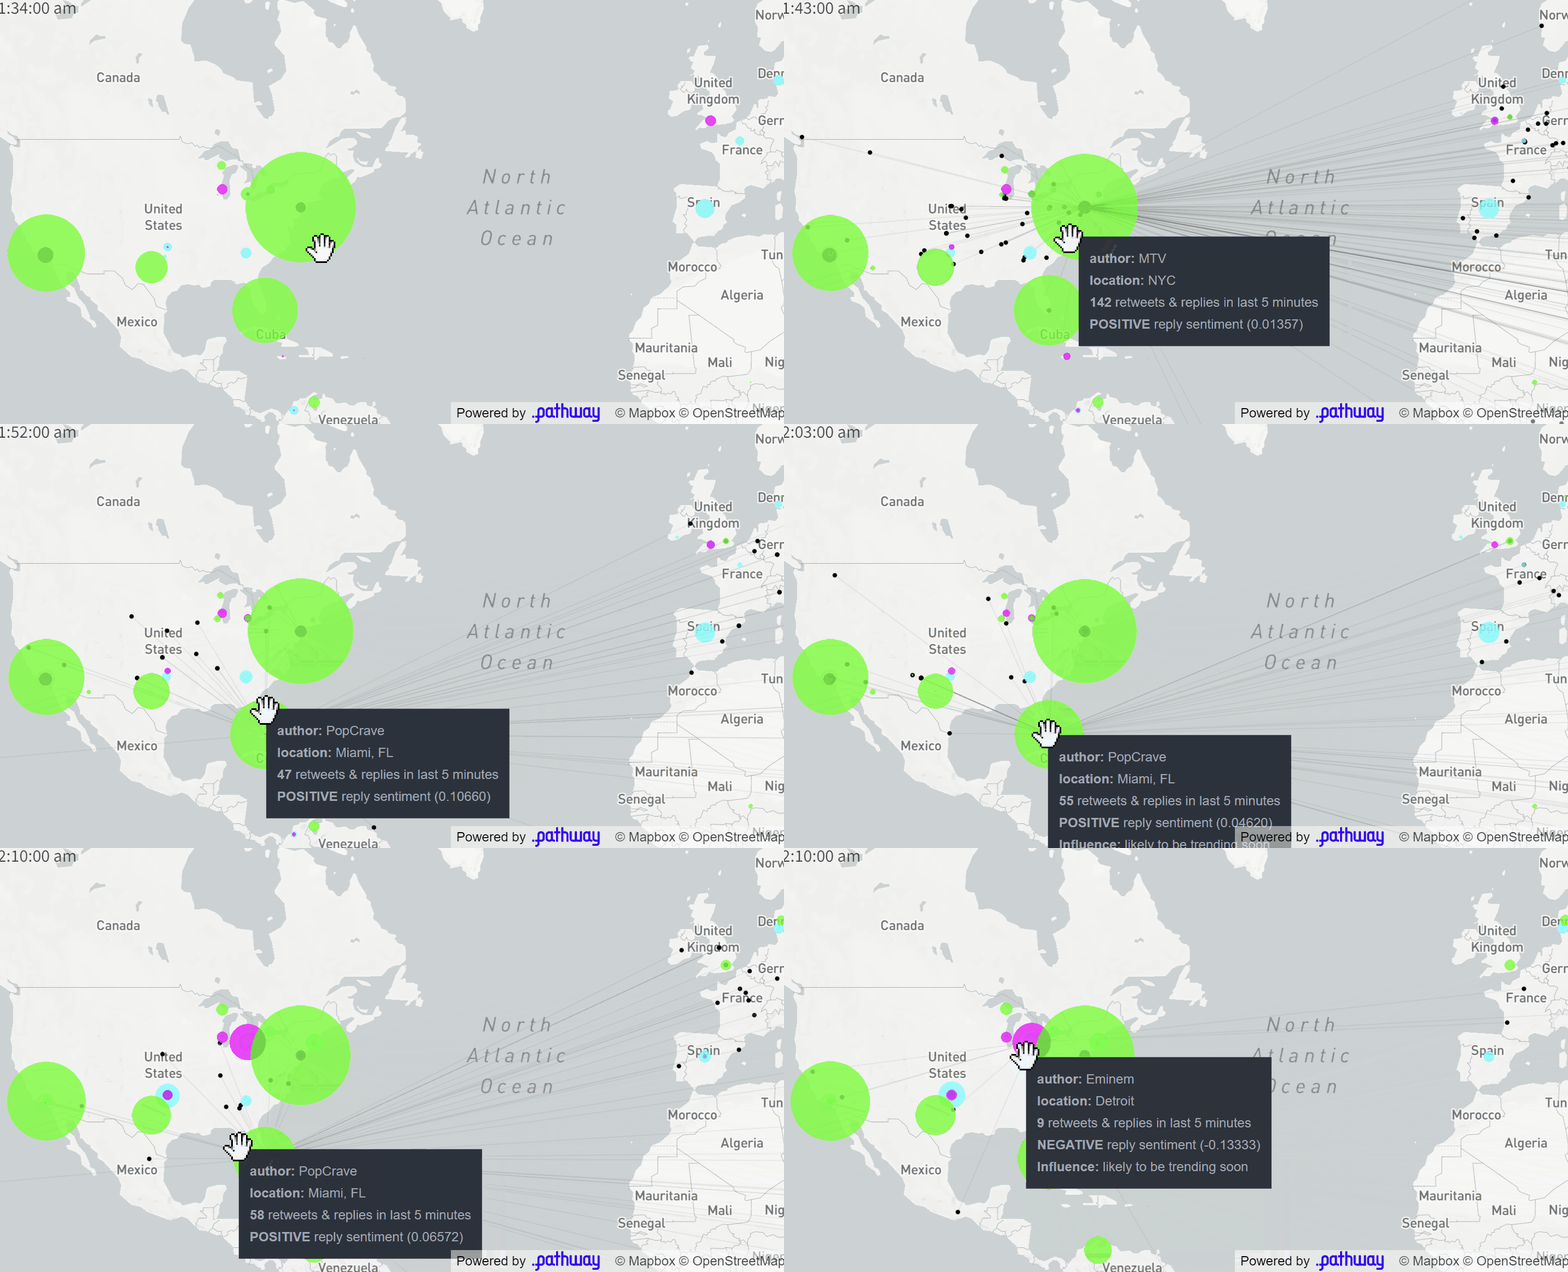
The final application displays a map of Twitter users who posted popular tweets on a given topic (e.g. #vmas tag for the MTV Awards, you can easily configure it to any topic you want). The size of each dot corresponds to the total influence of authors located in a given area on this topic. The influence is computed in real-time based on a current structure of retweets and replies to tweets (we will see how this is computed by Pathway at the end of this article). These users are clustered based on the sentiment their tweets are causing: green denotes positive reactions, cyan - neutral ones, magenta - negative ones.
All the results are visible on the map and summarized in the dynamic
table next to it.

We are going to use Pathway to achieve this result. Pathway is capable of handling different sources of live data, including geographical location data.
You will now see how Pathway can be used to:
- process a real-time stream of Twitter data,
- intelligently improve geolocation,
- perform sentiment analysis.
Thanks to Pathway, we can observe trends in real-time - the results are constantly updated as new tweets are posted. The app also allows for inspecting the past (by easily moving a time-window slider).
A unique feature of Pathway is that previously generated insights are constantly updated when new data is analyzed. Indeed, as Pathway gathers more and more data, it can update its beliefs about the past. In this showcase, Pathway updates measures of influence of users' Twitter activity as it is picked up on by others across the globe. Pathway also intelligently improves geolocation quality by flagging incorrect user locations, and retrospectively updates previous results.
A bird's eye view
Before we get to know how to write the real time Twitter analysis application, let's understand how Pathway fits in the final picture.
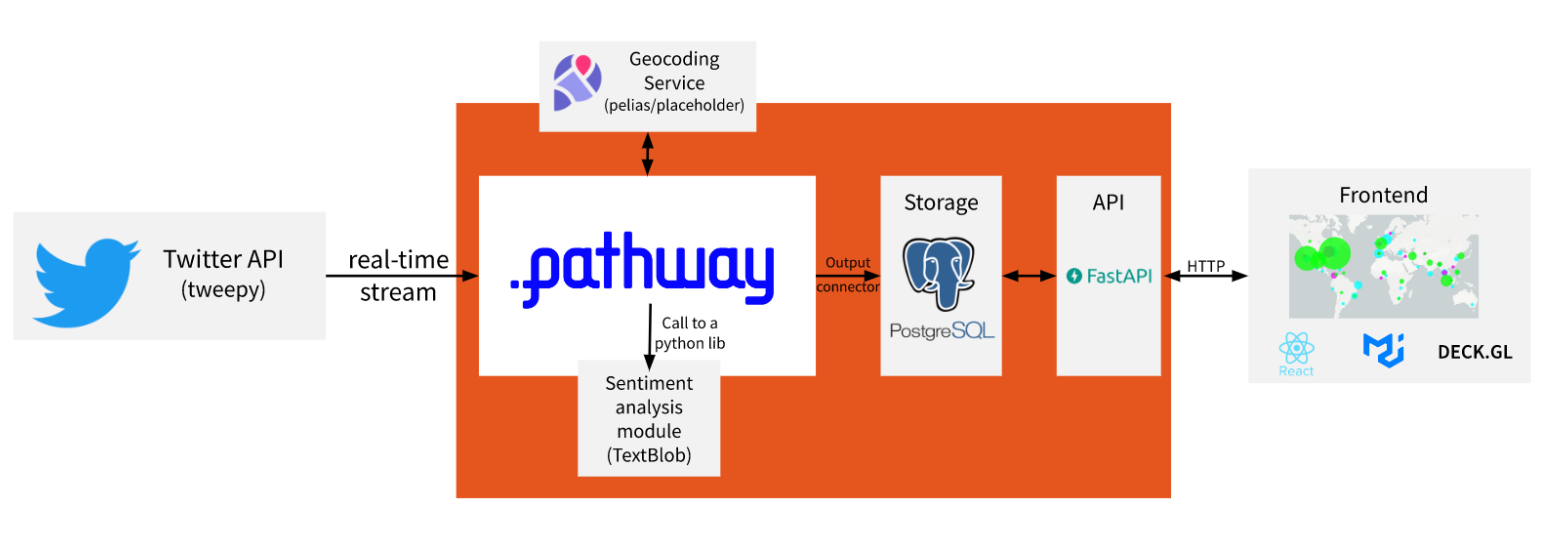
Pathway is the key technology that performs all the heavy backend computations for real-time data analysis.
To ingest data, our Python code sets Pathway up to connect via an input connector with a tiny Python script (tweepy) that fetches real-time tweets from the Twitter API.
⚠️ Twitter has turned off its free tier streaming API.
To provide outputs, Pathway is sending updates to the postgres database via a connector. The database is further queried by a webserver (here built with FastAPI) which serves the requested results. The requests come from the viewer's browser, and responses are visualized (here we wrote some code using popular javascript libraries like react, materialUI, and deck.gl).
What happens inside the "Pathway" block?
The code of Pathway apps is written in Python, and can call upon any external services and external Machine Learning models of the programmer's choice. In this way, Pathway apps fit nicely into the Python ecosystem.
For example, look inside our app code to see just how easy it is to call the TextBlob library for computing sentiment of the tweets.
Our Twitter analysis app also connects to a lightweight external service that provides some basic geocoding. The geocoding helps us obtain important information on longitude and latitude, as free Twitter data comes only in the form of a user-typed text, e.g. "Paris, France". As a matter of fact, since Twitter users often put misleading text as their location, basic geocoding is not enough to attain sufficient data quality. We add a couple of filters inside Pathway to clean erroneous locations at scale.
The Python code of Pathway apps provides for a mix of a data pipeline feel (through annotated Python functions) and a query-service feel (through annotated Python classes). In our Twitter case app, the input data goes through a pipeline built in Pathway which covers four steps.
Pipeline step 1: Tweets preprocessing
After connecting a real-time stream of tweets to Pathway, we have to clean them up a little bit. We do this entirely in Python, in Pathway's dataframe-flavored programming framework. We are interested only in retweets and replies to other tweets as we want to measure both local and global impact. We also want to retain tweets that have location data. For this, we fetch user data along with a tweet (it's already done by tweepy) and lookup the location field of the user. The location string is not useful by itself, as we need coordinates to measure the distances between the retweeters and the authors of the original tweets. We obtain users' coordinates by using placeholder) - the free coarse geocoder, which doesn't require tons of data and can be set up with a single line of code. Then, we can leverage Pathway to correct imperfections in the resulting geolocations from the placeholder geocoder.
Pipeline step 2: Iterative geolocation improvement with Pathway
Some Twitter users put weird locations, like instead of a place name they would put the text "turn on notifications" which gets geolocated to an incorrect place (the geocoding service does not provide any measures of confidence). To filter these out, we use an iterative process, in which we keep users that have a sufficiently large fraction of retweets that are near the tweeting user (within a radius of 200km). This can be expressed by the following pseudocode:
REPEAT UNTIL CONVERGENCE:
    For each tweeting user:
        close_fraction = fraction of nearby retweets
        if close_fraction < CUTOFF:
            *  make sure there is no other user in the same location
               with its "close_fraction" > CUTOFF
            *  filter out all tweets and retweets with this location
Note that this main loop may take more than one iteration. In the end, we take most of the broken locations off the map (the tweets stay in the data and are still used for computing statistics.)
Indeed, the key differentiator of Pathway is that it allows for writing such iterative workflows!
Pipeline step 3: Sentiment analysis with Pathway
The last step is to classify users by the general sentiment with which their tweets are received. To do that, for each retweet/reply, we find out the number in range [-1,1] representing the sentiment of the text ("<0" is negative, 0 neutral, ">0" is positive) and take the mean. Each of the numbers in question is computed via a one-liner by using the Pathway map function apply and calling the TextBlob library. The aggregation takes place in another line with a call to Pathway's "group-by".
We don't have to worry about updating aggregates as new data appears - Pathway will do that for us.
That's really it!
Pipeline step 4: Computing influence with Pathway
Now, let's turn to the importance of users' activity, as the voice of some of them carries more weight than that of others. In network science, we call it influence. The simplest way to measure the influence of a user would be to count the number of retweets. This would be a one-line "group by" aggregation in Pathway!
For this app, we used instead a slightly more involved formula, taking into account the number of followers and the overall activity of the retweeting users. Our influence measure is actually a pretty good "predictor" for the number of upcoming retweets - we can typically say which tweets are likely to create a significant buzz, before this actually happens.
Of course, you could come up with even better predictors of who's going to create a stir, for example using formulas which take into account parameters such as the length of the tweet, or diving deeper into the structure of the network.
With Pathway it is straightforward to formulate any rule or iterative algorithm we want - give it a try!
Wrapping up
As we have seen, Pathway allowed us to express complicated dataflows (even with iteration!) with a simple and intuitive syntax. It seamlessly integrates with any library within the Python ecosystem and is easy to connect and set up. Moreover, it can handle large quantities of data coming from different sources. Twitter is only one of many examples - we highly encourage you to explore Pathway's capabilities on your own and when you find your own applications, please share them with us at developer@pathway.com!
Run it on your own
All the code used for this showcase is available on the pathway-examples github repository. You can easily run it on your own on the topics that are interesting to you.
We are very curious to see what you will come up with!
In the meantime, please reach out, take care, and avoid caressing manuls.
